Paracrine regulation of angiogenesis and adipocyte differentiation during in vivo adipogenesis - PubMed (original) (raw)
Paracrine regulation of angiogenesis and adipocyte differentiation during in vivo adipogenesis
Dai Fukumura et al. Circ Res. 2003.
Erratum in
- Circ Res. 2004 Jan 9;94(1):e16
- Circ Res. 2005 May 13;96(9):e76
Abstract
With an increasing incidence of obesity worldwide, rational strategies are needed to control adipogenesis. Growth of any tissue requires the formation of a functional and mature vasculature. To gain mechanistic insight into the link between active adipogenesis and angiogenesis, we developed a model to visualize noninvasively and in real time both angiogenesis and adipogenesis using intravital microscopy. Implanted murine preadipocytes induced vigorous angiogenesis and formed fat pads in a mouse dorsal skin-fold chamber. The newly formed vessels subsequently remodeled into a mature network consisting of arterioles, capillaries, and venules, whereas the preadipocytes differentiated into adipocytes as confirmed by increased aP2 expression. Inhibition of adipocyte differentiation by transfection of preadipocytes with a peroxisome proliferator-activated receptor gamma dominant-negative construct not only abrogated fat tissue formation but also reduced angiogenesis. Surprisingly, inhibition of angiogenesis by vascular endothelial growth factor receptor-2 (VEGFR2) blocking antibody not only reduced angiogenesis and tissue growth but also inhibited preadipocyte differentiation. We found that part of this inhibition stems from the paracrine interaction between endothelial cells and preadipocytes and that VEGF-VEGFR2 signaling in endothelial cells, but not preadipocytes, mediates this process. These findings reveal a reciprocal regulation of adipogenesis and angiogenesis, and suggest that blockade of VEGF signaling can inhibit in vivo adipose tissue formation. The full text of this article is available online at http://www.circresaha.org.
Figures
Figure 1
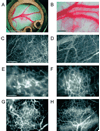
Angiogenesis and vessel remodeling during adipogenesis in the mouse dorsal skinfold chamber after 3T3-F442A cell implantation. A and B, Macroscopic images 9 days after implantation. C and D, Multiphoton laser-scanning microscopy images 28 days after preadipocyte implantation. Images were obtained by maximum intensity projection of 31 optical slices, each 5 µm thick: the top 150-µm de novo adipose tissue layer (C) and the bottom 150-µm host subcutaneous layer (D). E through H, High-power microscopic images of fluorescence contrast-enhanced blood vessels at 7 days (E), 14 days (F), 21 days (G), and 28 days (H) after implantation. Bars indicate 5 mm (A), 0.5 mm (B), 200 µm (C and D), and 100 µm (E through H), respectively.
Figure 2
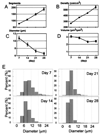
Quantitative analysis of blood vessels during adipogenesis (n=7 mice). A, Number of vessel segments in the high-power view field. B, Vascular length density. C, Vessel diameter. D, Calculated blood vessel volume. E, Vessel diameter histogram. Each vessel segment was categorized by diameter and shown as a cumulative frequency distribution. Segment diameters were distributed over a wide range at day 7. Distribution shifted leftward and the range became narrow as a result of vessel remodeling with continued adipogenesis. At day 28, most segments (92%) were 3 to 9 µm in diameter.
Figure 3
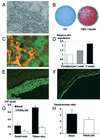
Differentiation of 3T3-F442A preadipocytes and de novo adipose tissue formation: the effect of PPARγ-DN. A, Bright-field microscopic image of differentiated adipocytes in vitro. B, Macroscopic images of Oil Red O staining. C, Fluorescence image of differentiated adipocytes in vivo. To identify implanted cells in vivo, we used GFP-labeled preadipocytes. We found fat accumulation in GFP-positive cells during conversion of fibroblast-shaped preadipocytes to round-shaped adipocytes. This was visible as granular fluorescence due to fat droplets in the cytosol and was observed by multiphoton microscope (with rhodamine-dextran vessel enhancement). D, Active adipogenesis on a subcutaneous cell implant, confirmed by increasing aP2 levels (values shown after quantitative densitometry of a Northern blot analysis). E and F, Fluorescence microscopy in tissue sections from (E) mock- and (F) PPARγ-DN–transfected preadipocyte-generated tissues. G and H, Histological analyses of tissue expansion and cell size. G, An increased number of cells and tissue area is seen in mock preadipocyte tissue compared with PPARγ-DN tissue. H, Number of cells per tissue area is decreased in mock preadipocyte–generated tissue, documenting the increase in size of the cells in these tissues. *P<0.01 as compared with corresponding control by two-tailed t test; **P<0.05 using the Wilcoxon rank-sum test. Bars=50 µm (A), 50 µm (C), and 0.5 mm (E and F), respectively.
Figure 4
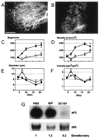
Effect of PPARγ-DN on angiogenesis in the adipose tissue generated from preadipocytes. A and B, Fluorescence images of blood vessels 21 days after mock- (A) and PPARγ-DN–transfected (B) preadipocyte implantation. Bar=100 µm. C through F, Quantitative analyses of tissue neovascularization: C, number of vessel segments; D, vascular length density; E, vessel diameter; F, vessel volume. Filled circles, control (n=6); open squares, PPARγ-dominant-negative–transfected preadipocytes (n=5). There was no difference between the two different sets of control cells (mock-transfected preadipocytes, n=3 mice, and EF1α-GFP 3T3-F442A cells, n=3). These two groups are combined for presentation and statistical analysis. *P<0.01 as compared with corresponding control by two-tailed t test.
Figure 5
Effect of VEGFR2 blockade on angiogenesis and adipogenesis. A and B, Visualization of rhodamine-dextran contrast-enhanced blood vessels 21 days after preadipocyte implantation with control IgG (A) and DC101 (B) treatments. C through F, Quantitative analyses of tissue neovascularization: C, number of vessel segments; D, vascular length density; E, vessel diameter; F, vessel volume. Filled circles represent IgG treatment (n=6 mice); open squares, DC101 treatment (n=6 mice). *P<0.01 as compared with IgG by two-tailed t test. G, In vivo gene expression of aP2 in preadipocyte-generated tissue with densitometry normalized to control condition (PBS).
Figure 6
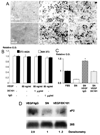
Role of VEGFR2 signaling in preadipocyte differentiation and proliferation. A, Confluent 3T3-F442A cells were maintained for 11 days with either 10% calf serum (CS, maintenance media) with or without VEGF (50 ng/mL) or 10% FBS (differentiation media) and either DC101 or rat IgG (1 µg/mL). At day 11, cells were stained with Oil Red O. Mouse recombinant VEGF did not induce differentiation in preadipocytes cultured in 10% CS (maintenance media) and did not increase the differentiation rate in cells treated with 10% FBS (differentiation media). Addition of DC101 or IgG to the culture media had no effect on in vitro adipogenesis. Bar=50 µm. B, Mouse recombinant VEGF (50 ng/mL) and PBS, DC101, or rat IgG was added (concentration of the antibodies, 1 µg/mL), and the MTT assay was performed at day 4. The optical density values were normalized to that of the PBS-treated cells and were used as a measure of viability. C, MTT assay for preadipocytes after 4 days of culture with endothelial conditioned media [FBS indicates nonconditioned culture media with 10% FBS; SN, supernatant, endothelial conditioned media cultured with 10% FBS but no other additives; SN/VEGF/IgG, endothelial conditioned media cultured with 10% FBS, VEGF (50 ng/mL) and nonspecific IgG (5 µg/mL); SN/VEGF/DC101, endothelial conditioned media cultured with 10% FBS, VEGF (50 ng/mL) and DC101 (5 µg/mL)]. Data were normalized to the control condition (FBS). *P<0.01 as compared with SN/VEGF/DC101 by two-tailed t test. Error bars represent standard error. D, In vitro gene expression of aP2 in preadipocytes after 11 days of culture with endothelial conditioned media (VEGF/IgG, endothelial conditioned media cultured with 10% FBS, VEGF, and nonspecific IgG; SN, endothelial conditioned media with 10% FBS and no other additives; VEGF/DC101, endothelial conditioned media cultured with 10% FBS, VEGF, and DC101). Fold increase in aP2 expression by differentiating preadipocytes was calculated by densitometry and normalized to the control condition (SN).
Similar articles
- The farnesoid X receptor promotes adipocyte differentiation and regulates adipose cell function in vivo.
Rizzo G, Disante M, Mencarelli A, Renga B, Gioiello A, Pellicciari R, Fiorucci S. Rizzo G, et al. Mol Pharmacol. 2006 Oct;70(4):1164-73. doi: 10.1124/mol.106.023820. Epub 2006 Jun 15. Mol Pharmacol. 2006. PMID: 16778009 - CREB activation induces adipogenesis in 3T3-L1 cells.
Reusch JE, Colton LA, Klemm DJ. Reusch JE, et al. Mol Cell Biol. 2000 Feb;20(3):1008-20. doi: 10.1128/MCB.20.3.1008-1020.2000. Mol Cell Biol. 2000. PMID: 10629058 Free PMC article. - Adipose tissue angiogenesis.
Hausman GJ, Richardson RL. Hausman GJ, et al. J Anim Sci. 2004 Mar;82(3):925-34. doi: 10.2527/2004.823925x. J Anim Sci. 2004. PMID: 15032451 Review. - GATA transcription factors and fat cell formation.
Tong Q, Tsai J, Hotamisligil GS. Tong Q, et al. Drug News Perspect. 2003 Nov;16(9):585-8. doi: 10.1358/dnp.2003.16.9.829340. Drug News Perspect. 2003. PMID: 14702139 Review.
Cited by
- Cotransplantation of adipose-derived mesenchymal stromal cells and endothelial cells in a modular construct drives vascularization in SCID/bg mice.
Butler MJ, Sefton MV. Butler MJ, et al. Tissue Eng Part A. 2012 Aug;18(15-16):1628-41. doi: 10.1089/ten.TEA.2011.0467. Epub 2012 Jul 9. Tissue Eng Part A. 2012. PMID: 22655687 Free PMC article. - Pleiotropy of tissue-specific growth factors: from neurons to vessels via the bone marrow.
Duda DG, Jain RK. Duda DG, et al. J Clin Invest. 2005 Mar;115(3):596-8. doi: 10.1172/JCI24511. J Clin Invest. 2005. PMID: 15765145 Free PMC article. - Adipose tissue remodeling and obesity.
Sun K, Kusminski CM, Scherer PE. Sun K, et al. J Clin Invest. 2011 Jun;121(6):2094-101. doi: 10.1172/JCI45887. Epub 2011 Jun 1. J Clin Invest. 2011. PMID: 21633177 Free PMC article. Review. - Suppression of Endothelial AGO1 Promotes Adipose Tissue Browning and Improves Metabolic Dysfunction.
Tang X, Miao Y, Luo Y, Sriram K, Qi Z, Lin FM, Gu Y, Lai CH, Hsu CY, Peterson KL, Van Keuren-Jensen K, Fueger PT, Yeo GW, Natarajan R, Zhong S, Chen ZB. Tang X, et al. Circulation. 2020 Jul 28;142(4):365-379. doi: 10.1161/CIRCULATIONAHA.119.041231. Epub 2020 May 12. Circulation. 2020. PMID: 32393053 Free PMC article. - Pericytes at the intersection between tissue regeneration and pathology.
Birbrair A, Zhang T, Wang ZM, Messi ML, Mintz A, Delbono O. Birbrair A, et al. Clin Sci (Lond). 2015 Jan;128(2):81-93. doi: 10.1042/CS20140278. Clin Sci (Lond). 2015. PMID: 25236972 Free PMC article. Review.
References
- Silverman KJ, Lund DP, Zetter BR, Lainey LL, Shahood JA, Freiman DG, Folkman J, Barger AC. Angiogenic activity of adipose tissue. Biochem Biophys Res Commun. 1988;153:347–352. - PubMed
- Sierra-Honigmann MR, Nath AK, Murakami C, Garcia-Cardena G, Papapetropoulos A, Sessa WC, Madge LA, Schechner JS, Schwabb MB, Polverini PJ, Flores-Riveros JR. Biological action of leptin as an angiogenic factor. Science. 1998;281:1683–1686. - PubMed
- Gregoire FM, Smas CM, Sul HS. Understanding adipocyte differentiation. Physiol Rev. 1998;78:783–809. - PubMed
- Jain RK, Munn LL, Fukumura D. Dissecting tumor pathophysiology using intravital microscopy. Nat Rev Cancer. 2002;2:266–276. - PubMed
Publication types
MeSH terms
Substances
Grants and funding
- T32 CA073479/CA/NCI NIH HHS/United States
- T32 CA073479-11/CA/NCI NIH HHS/United States
- R01 CA085140/CA/NCI NIH HHS/United States
- P01-CA80124/CA/NCI NIH HHS/United States
- R01 CA085140-06/CA/NCI NIH HHS/United States
- P01 CA080124/CA/NCI NIH HHS/United States
- R24-CA85140/CA/NCI NIH HHS/United States
- R24 CA085140/CA/NCI NIH HHS/United States
- T32-CA73479/CA/NCI NIH HHS/United States
- Wellcome Trust/United Kingdom
- P01 CA080124-08/CA/NCI NIH HHS/United States
LinkOut - more resources
Full Text Sources
Other Literature Sources
Research Materials
