Mutant huntingtin impairs axonal trafficking in mammalian neurons in vivo and in vitro - PubMed (original) (raw)
. 2004 Sep;24(18):8195-209.
doi: 10.1128/MCB.24.18.8195-8209.2004.
Roy B Dyer, John D Badger 2nd, Daren Ure, Lars Eide, David D Tran, Brent T Vrieze, Valerie Legendre-Guillemin, Peter S McPherson, Bhaskar S Mandavilli, Bennett Van Houten, Scott Zeitlin, Mark McNiven, Ruedi Aebersold, Michael Hayden, Joseph E Parisi, Erling Seeberg, Ioannis Dragatsis, Kelly Doyle, Anna Bender, Celin Chacko, Cynthia T McMurray
Affiliations
- PMID: 15340079
- PMCID: PMC515048
- DOI: 10.1128/MCB.24.18.8195-8209.2004
Mutant huntingtin impairs axonal trafficking in mammalian neurons in vivo and in vitro
Eugenia Trushina et al. Mol Cell Biol. 2004 Sep.
Abstract
Recent data in invertebrates demonstrated that huntingtin (htt) is essential for fast axonal trafficking. Here, we provide direct and functional evidence that htt is involved in fast axonal trafficking in mammals. Moreover, expression of full-length mutant htt (mhtt) impairs vesicular and mitochondrial trafficking in mammalian neurons in vitro and in whole animals in vivo. Particularly, mitochondria become progressively immobilized and stop more frequently in neurons from transgenic animals. These defects occurred early in development prior to the onset of measurable neurological or mitochondrial abnormalities. Consistent with a progressive loss of function, wild-type htt, trafficking motors, and mitochondrial components were selectively sequestered by mhtt in human Huntington's disease-affected brain. Data provide a model for how loss of htt function causes toxicity; mhtt-mediated aggregation sequesters htt and components of trafficking machinery leading to loss of mitochondrial motility and eventual mitochondrial dysfunction.
Figures
FIG. 1.
mhtt expression causes inhibition of trafficking in neurons of transgenic mice as visualized by DIC optics. (A) Examples of round and elongated particles as they appear using DIC optics. Images are shown at different magnification (top, 63× with 4× extender; bottom, 100× with 4× extender and 2× zoom). White arrows indicate round particles, black arrows indicate elongated particles. (B) Time-lapse DIC images of particle motility taken 1 s apart. A round vesicle moving towards the cell body is indicated by an arrow. The line is an arbitrary point of reference. Technical details are described in Materials and Methods. (C) DIC imaging does not affect neuronal health. Phase images (63× oil DIC, 1.4 n.a.) of primary striatal neuronal cultures before and after 30 min of DIC imaging. Scale bar, 20 μm. (D) DIC imaging does not affect synaptic activity. Primary striatal neurons immunostained with synapsin antibody before and after 30 min of DIC imaging (63× oil DIC, 1.4 n.a.). Scale bar, 20 μm. Analysis of speed (panel E), pattern of motion (panel F), and number of moving round and elongated particles (panel G) in striatal neurons from control (C) and transgenic mice expressing htt with 16 (HD16) or 72 (HD72) glutamines obtained using DIC optics. (E) Velocity of particles in micrometers per second. N, number of neurites observed; *, P < 0.0001; **, P < 0.01. Thirty to 50 particles were randomly selected for evaluation in every group. (F) Analysis of pattern of motion includes all particles observed (round and elongated). SL, saltatory (back and forth without net direction); ST, stationary (no motion); SM, smooth (without stops over the range of 50 μm); S-G, stop-and-go (the particle stops for a period of time before resuming motion); P, number of particles evaluated; *, P < 0.0001. (G) The percentage of particles moving in neurites in the A or R direction is significantly lower in neurons from HD72 mice. *, P < 0.0001. Statistical analysis in panels F and G was done by chi-square test.
FIG. 2.
Retrograde transport of FG into striatum is slow in mice expressing mhtt. (A) Injection scheme for FG uptake. FG was injected into substantia nigra, and uptake in striatum was monitored with time. (B) Quantification of the number of neurons that accumulate FG in the cell bodies in control and HD72 mice 1 and 3 days after the injection. Horizontal lines represent 0, 50, 100, etc. cells labeled/mouse. Black bars, control FVB/N mice; white bars, HD72 mice; *, P < 0.01 (t test). (C) Retrograde uptake of FG in striatum of control mice 3 days after the injection. The box indicates the area in the striatum that was used for quantification in panel B. Scale bar, 200 μm. (D) View of cortical neurons with FG accumulation in the cell bodies. Scale bar, 50 μm. (E, F) FG uptake in the striatum of control (E) and HD72 (F) mice 1 day after the injection. Neuronal cell bodies labeled with FG are seen as bright circular structures in tissue. Scale bar, 50 μm.
FIG. 3.
Analysis of mitochondrial motion in neurons from control, transgenic, and htt KO mice visualized by TMRM staining. (A) Image of striatal neuron stained with TMRM; red are stationary mitochondria and green are moving mitochondria identified by computer and appropriately colored. Most moving mitochondria are in the neurites. The arrow indicates the cell body. (B) An example of time-lapse recording of a TMRM-stained mitochondrion moving in the R direction along the axon in an E17 striatal neuron. Phase and fluorescence images are shown. The arrow and circle indicate the mitochondrion being traced. (C) Schematic diagram of speed calculations used in the analysis of mitochondrial movement. Speedmov (speed when moving) was calculated by dividing the distance over time for every step in which mitochondria moved (double arrows), and data were averaged. In this example, time equals the sum of steps 1, 3, and 5. No time for stationary phases was included. SpeedAve (average speed) was calculated by dividing distance by total time that includes both moving and stationary phases (sum of steps 1, 2, 3, 4, and 5).
FIG. 4.
Pattern of mitochondria motion in neurites of control and HD-affected mice. The majority of mitochondria in control neurons cover a longer distance in a shorter time and stop less frequently than mitochondria in HD-affected mice. The pattern of motion was recorded for randomly selected individual mitochondria from 10 to 15 neurons that could be traced for over 150 s or moved over the distance of 50 μm. Stationary and mobile phases were plotted over time.
FIG. 5.
Ultrastructure and function of mitochondria from control and HD-affected mice. Mitochondria morphology was not altered in embryonic striatal neurons (E17) in control (A) or HD72 (B) mice. Scale bar, 10 nm. There was also no detection of abnormal mitochondria accumulation in neuritis in HD72 neurons (C) compared to control (not shown). Scale bar, 1 μm. M, mitochondrion. (D) Trafficking defects precede mitochondrial dysfunction in HD72 mice. Mitochondria function (ATP synthesis and lactate accumulation) was not altered in embryonic (E17) striatal neurons in HD72 mice compared to control despite detected abnormalities in mitochondrial trafficking. At the same time, increased lactate accumulation was measured in adult HD72 mice (12 months). There was also no difference in mitochondrial DNA damage in striatal tissue from control, HD16, and HD72 mice at 12 weeks. Estimated mitochondrial (MT) and nuclear (β-polymerase and β-globin) DNA damage was measured by quantitative PCR in striatal tissues (see Materials and Methods). ATPHD/ATPC is the ratio of ATP generated within E17 cultures of HD16 or HD72 animals (ATPHD) to that of control neurons (ATPC). LactateHD/LactateC is the ratio of lactate measured in E17 striatal cultures or striatal tissue from HD72 mice (lactateHD) to that of control mice (lactateC). Age is indicated.
FIG. 6.
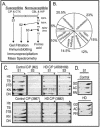
Components of the trafficking machinery are sequestered in human HD-affected brain. (A) Extraction scheme used to resolve proteins based on their solubility. Age- and gender-matched human brain tissues in HD-affected (C/P, CTX) and spared (CBL, HIP) regions were prepared as described in Materials and Methods. The S1 fraction contains proteins that are the most soluble, S2 contains proteins of intermediate solubility, and S3 represents the least soluble proteins that are specific to the HD-affected brain. CTX, cerebral cortex; CBL, cerebellar cortex; C/P, caudate and putamen; HIP, hippocampus; RIPA, radioimmunoprecipitation assay buffer. (B) Distribution of cytoplasmic, nonmetabolic proteins identified by mass spectrometry in gel filtration fractions of S3 extracts of HD-affected caudate and putamen. Note that mitochondrial and cytoskeletal proteins constitute the largest portion of this pool. (C) Redistribution of cytoskeleton and trafficking motors from S1 to S3 in HD-affected brain. Gel filtration profiles of htt, α-tubulin (TB), neuronal specific βIII-tubulin (βTB), kinesin (KN), and dynactin p150Glued (DN) in the S1 and S3 extracts of HD-affected caudate and putamen. Equal total protein amounts were resolved by size exclusion chromatography, and then an equal volume of each fraction was analyzed by immunoblotting. Data from two human control brains (M2 and 3867), age- and gender-matched with two human HD-affected brains (AR98189 and 3882), are shown. The asterisk indicates the predicted migration of a htt monomer. (D) Migration of nontrafficking proteins, actin (AC), GAPDH (GD), and Ran (RN) was unaffected in HD-affected compared to control brain.
FIG. 7.
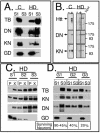
mhtt causes redistribution of soluble htt, cytoskeletal proteins, and trafficking motors to poorly soluble S3 extracts of human HD-affected brain. (A) An equal amount of total protein was analyzed for solubility by comparing S1 and S3 extracts by immunoblotting. Trafficking proteins α-tubulin (TB), dynactin (DN), and kinesin (KN) are present only in the S1 extract of control brain but are redistributed to the S3 extract in the HD-affected human brain. Control (C) and HD-affected brain extracts are from the caudate and putamen regions. GAPDH (GD) remains in the S1 of both control and HD-affected brain. (B) Trafficking proteins interact with both normal and mhtt in human brain. Immunoprecipitation of htt, dynactin, and kinesin from an S1 extract of control brain or from S3 gel filtration fractions of HD-affected brain. Since no htt was present in the S3 extract of control brain, it was not analyzed. Immunoprecipitation utilized the 2166 htt antibody; −, protein G beads alone; +, protein G beads cross-linked with antibody. Input is 8% of the protein sample in the immunoprecipitation reactions. (C) Reduced solubility of α-tubulin, kinesin, and dynactin in the brain regions vulnerable to HD. An equal amount of total protein from the S1, S2, and S3 extracts of grade 1 caudate-putamen (P) or cerebral cortex (X) was analyzed by immunoblotting. The motor-associated proteins are enriched in the poorly soluble S3 extract. The control protein GAPDH is found predominantly in the soluble S1 extract. (D) Solubility of trafficking proteins as a function of disease severity. An equal amount of total protein from S1 and S3 extracts from the caudate and putamen of three HD-affected brains of grade 1 (G1), 2 (G2), and 3 (G3) were probed for α-tubulin, kinesin, dynactin, and GAPDH. The level of α-tubulin, kinesin, and dynactin in S1 increases with grade and decreases with the average number of surviving neurons characteristic of each grade as previously described (44). The level of proteins in S3 shows the inverse pattern. The control protein GAPDH remains totally soluble in both control and HD-affected brains. (E) Colocalization of htt and trafficking proteins in fibroblasts from control individuals and HD patients. Note colocalization of htt with kinesin, α-tubulin, and dynactin but not with GAPDH. In all panels, htt is green; kinesin, dynactin, GAPDH, and α-tubulin are red; blue indicates the nucleus. Overlays are indicated. Confocal images were taken with 100× oil DIC (1.4 n.a.), thickness of the slices was ∼0.5 μm. Scale bar, 10 μm.
FIG. 8.
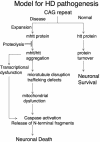
Proposed mechanism of neuronal dysfunction in HD. Model for HD pathogenesis that includes inhibition of mhtt proteolysis and initiation of aggregation that involves specific cellular targets along with wild-type htt. Sequestration leads to disruption of cytoskeleton, vesicular and organelle trafficking, transcriptional dysfunction, and eventually causes mitochondrial dysfunction and neuronal death.
Similar articles
- The regulation of autophagosome dynamics by huntingtin and HAP1 is disrupted by expression of mutant huntingtin, leading to defective cargo degradation.
Wong YC, Holzbaur EL. Wong YC, et al. J Neurosci. 2014 Jan 22;34(4):1293-305. doi: 10.1523/JNEUROSCI.1870-13.2014. J Neurosci. 2014. PMID: 24453320 Free PMC article. - Mutant huntingtin aggregates impair mitochondrial movement and trafficking in cortical neurons.
Chang DT, Rintoul GL, Pandipati S, Reynolds IJ. Chang DT, et al. Neurobiol Dis. 2006 May;22(2):388-400. doi: 10.1016/j.nbd.2005.12.007. Epub 2006 Feb 9. Neurobiol Dis. 2006. PMID: 16473015 - Huntingtin-mediated axonal transport requires arginine methylation by PRMT6.
Migazzi A, Scaramuzzino C, Anderson EN, Tripathy D, Hernández IH, Grant RA, Roccuzzo M, Tosatto L, Virlogeux A, Zuccato C, Caricasole A, Ratovitski T, Ross CA, Pandey UB, Lucas JJ, Saudou F, Pennuto M, Basso M. Migazzi A, et al. Cell Rep. 2021 Apr 13;35(2):108980. doi: 10.1016/j.celrep.2021.108980. Cell Rep. 2021. PMID: 33852844 Free PMC article. - Mutant huntingtin, abnormal mitochondrial dynamics, defective axonal transport of mitochondria, and selective synaptic degeneration in Huntington's disease.
Reddy PH, Shirendeb UP. Reddy PH, et al. Biochim Biophys Acta. 2012 Feb;1822(2):101-10. doi: 10.1016/j.bbadis.2011.10.016. Epub 2011 Nov 4. Biochim Biophys Acta. 2012. PMID: 22080977 Free PMC article. Review. - Nature and cause of mitochondrial dysfunction in Huntington's disease: focusing on huntingtin and the striatum.
Oliveira JM. Oliveira JM. J Neurochem. 2010 Jul;114(1):1-12. doi: 10.1111/j.1471-4159.2010.06741.x. Epub 2010 Apr 9. J Neurochem. 2010. PMID: 20403078 Review.
Cited by
- Optineurin-facilitated axonal mitochondria delivery promotes neuroprotection and axon regeneration.
Liu D, Webber HC, Bian F, Xu Y, Prakash M, Feng X, Yang M, Yang H, You IJ, Li L, Liu L, Liu P, Huang H, Chang CY, Liu L, Shah SH, Torre A, Welsbie DS, Sun Y, Duan X, Goldberg JL, Braun M, Lansky Z, Hu Y. Liu D, et al. bioRxiv [Preprint]. 2024 Apr 3:2024.04.02.587832. doi: 10.1101/2024.04.02.587832. bioRxiv. 2024. PMID: 38617277 Free PMC article. Preprint. - Interactions of amyloidogenic proteins with mitochondrial protein import machinery in aging-related neurodegenerative diseases.
Reed AL, Mitchell W, Alexandrescu AT, Alder NN. Reed AL, et al. Front Physiol. 2023 Nov 2;14:1263420. doi: 10.3389/fphys.2023.1263420. eCollection 2023. Front Physiol. 2023. PMID: 38028797 Free PMC article. Review. - From Pathogenesis to Therapeutics: A Review of 150 Years of Huntington's Disease Research.
Jiang A, Handley RR, Lehnert K, Snell RG. Jiang A, et al. Int J Mol Sci. 2023 Aug 21;24(16):13021. doi: 10.3390/ijms241613021. Int J Mol Sci. 2023. PMID: 37629202 Free PMC article. Review. - Mitochondrial Dysfunction in Repeat Expansion Diseases.
Giménez-Bejarano A, Alegre-Cortés E, Yakhine-Diop SMS, Gómez-Suaga P, Fuentes JM. Giménez-Bejarano A, et al. Antioxidants (Basel). 2023 Aug 10;12(8):1593. doi: 10.3390/antiox12081593. Antioxidants (Basel). 2023. PMID: 37627588 Free PMC article. Review. - Treponema denticola Has the Potential to Cause Neurodegeneration in the Midbrain via the Periodontal Route of Infection-Narrative Review.
Pisani F, Pisani V, Arcangeli F, Harding A, Singhrao SK. Pisani F, et al. Int J Environ Res Public Health. 2023 Jun 4;20(11):6049. doi: 10.3390/ijerph20116049. Int J Environ Res Public Health. 2023. PMID: 37297653 Free PMC article. Review.
References
- Albin, R. L., A. Reiner, K. D. Anderson, L. S. Dure IV, B. Handelin, R. Balfour, W. O. Whetsell, Jr., J. B. Penney, and A. B. Young. 1992. Preferential loss of striato-external pallidal projection neurons in presymptomatic Huntington's disease. Ann. Neurol. 31:425-430. - PubMed
- Ayala-Torres, S., Y. Chen, T. Svoboda, J. Rosenblatt, and B. Van Houten. 2000. Analysis of gene-specific DNA damage and repair using quantitative PCR. Methods Companion Methods Enzymol. 22:135-147. - PubMed
- Barnes, G. T., M. P. Duyao, C. M. Ambrose, S. McNeil, F. Persichetti, J. Srinidhi, J. F. Gusella, and M. E. MacDonald. 1994. Mouse Huntington's disease gene homolog (Hdh). Somat. Cell Mol. Genet. 20:87-97. - PubMed
- Brennan, W. A., Jr., E. D. Bird, and J. R. Aprille. 1985. Regional mitochondrial respiratory activity in Huntington's disease brain. J. Neurochem. 44:1948-1950. - PubMed
Publication types
MeSH terms
Substances
LinkOut - more resources
Full Text Sources
Other Literature Sources
Molecular Biology Databases
Miscellaneous


