Coordination of nuclear and mitochondrial genome expression during mitochondrial biogenesis in Arabidopsis - PubMed (original) (raw)
Coordination of nuclear and mitochondrial genome expression during mitochondrial biogenesis in Arabidopsis
Philippe Giegé et al. Plant Cell. 2005 May.
Abstract
Mitochondrial biogenesis and function require the regulated and coordinated expression of nuclear and mitochondrial genomes throughout plant development and in response to cellular and environmental signals. To investigate the levels at which the expression of nuclear and mitochondrially encoded proteins is coordinated, we established an Arabidopsis thaliana cell culture system to modulate mitochondrial biogenesis in response to sugar starvation and refeeding. Sucrose deprivation led to structural changes in mitochondria, a decrease in mitochondrial volume, and a reduction in the rate of cellular respiration. All these changes could be reversed by the readdition of sucrose. Analysis of the relative mRNA transcript abundance of genes encoding nuclear and mitochondrially encoded proteins revealed that there was no coordination of expression of the two genomes at the transcript level. An analysis of changes in abundance and assembly of nuclear-encoded and mitochondrially encoded subunits of complexes I to V of the mitochondrial inner membrane in organello protein synthesis and competence for protein import by isolated mitochondria suggested that coordination occurs at the level of protein-complex assembly. These results further suggest that expression of the mitochondrial genome is insensitive to the stress imposed by sugar starvation and that mitochondrial biogenesis is regulated by changes in nuclear gene expression and coordinated at the posttranslational level.
Figures
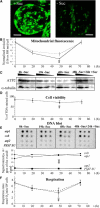
Figure 1.
Modulation of Mitochondrial Biogenesis during Sugar Starvation of Arabidopsis Cell Cultures. Samples were taken at 0, 19, and 48 h after transfer to a minus sucrose medium and at 24 h after transfer of 48 h starved cells (vertical gray arrow) into a plus sucrose medium (72 h). (A) Control (+ Suc) and sucrose-starved (− Suc) cell samples were stained at 19 h with Mito Tracker Green FM and visualized by confocal microscopy. Bars = 5 μm. (B) Fluorescence emission of cells at 516 nm for Mito Green FM (solid line) and at 509 nm for GFP (dashed line), divided by the emission of a blank and normalized for the number of cells. (C) Protein gel blot analysis of mitochondrial ATP2 and cytosolic α-tubulin of 20, 10, and 5 μg of total cellular protein isolated at the four time points. (D) Cell viability estimated by counting the percentage of fluorescent cells after FDA staining. (E) Changes in nuclear and mitochondrial genome copy number. Labeled total DNA extracted from cells isolated at the four time points was hybridized on nylon filters spotted with 500, 150, and 50 ng of atp1, cob, atp2, and complex I PSST subunit-specific PCR products. The average signal, quantified with a phosphor imager, was plotted against time. (F) Respiration rate of an equal number of cells at each time point measured either in the growth medium in which they were cultured (solid line) or after transfer into fresh sucrose-containing medium 1 h before measurement (dashed line). Values displayed are the average of three independent experiments, with standard deviation as error bars.
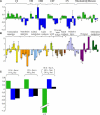
Figure 2.
The Effect of Sugar Starvation on Changes in Transcript Abundance of All Mitochondrial Genes, Nuclear Genes Encoding Major Subunits of the Major Respiratory Enzyme Complexes, and a Selection of Nuclear Genes Encoding Representative Proteins Involved in Gene Expression and Other Areas of Cellular Metabolism. Changes in transcript abundance of the individual genes are expressed as base 2 log ratios, in the order listed in Table 1, in cultures grown for 19 h plus and minus sucrose. (A) Mitochondrial genes encoding components of the respiratory chain complexes (I to V) and the mitochondrial ribosome are shown in green and the nuclear-encoded components in blue. (B) Genes encoding proteins involved in other aspects of cellular metabolism and color coded according to functional families. Genes marked with an asterisk were not significantly regulated between 19 h plus and 19 h minus sucrose. (C) Changes in the average transcript abundance (average log ratio of the genes significantly regulated) for mitochondrially encoded proteins (green), nuclear-encoded proteins present in respiratory enzyme complexes with mitochondrial gene products (blue), and all of the nuclear-encoded gene products represented on the microarray (black), corresponding to the sampling times described in Figure 1. Error bars represent standard deviations for three independent experiments.
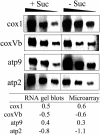
Figure 3.
Validation of Microarray Data. RNA gel blots with 10, 5, and 2.5 μg of total RNA extracted from cells grown for 19 h plus and minus sucrose were hybridized with specific labeled PCR products representing the mitochondrially encoded cytochrome oxidase subunit 1 (cox1) and atp9 and the nuclear-encoded cytochrome oxidase subunit Vb (coxVb) and atp2 genes. Signals were quantified with a phosphor imager and averaged for the three amounts of RNA used. A base 2 log ratio of the +S and –S signal intensities was calculated and compared in the table with the results obtained for the microarray experiments.
Figure 4.
The Effect of Sucrose Starvation on the Amount of Mitochondrially and Nuclear-Encoded Proteins from Respiratory Complexes I to V (CI to CV) in Mitochondria from Arabidopsis Cell Cultures. (A) Mitochondria were isolated from cultures grown for 19 h plus (+ Suc) or minus (− Suc) sucrose and total protein analyzed by two-dimensional isoelectric focusing (IEF), SDS-PAGE. ATP1 and ATP2 were localized on these gels as described previously (Millar et al., 2001). (B) Protein gel blots of equal amounts (20, 10, and 5 μg) of total mitochondrial protein isolated from cultures grown for 19 h plus (+ Suc) or minus (− Suc) sucrose and probed with antibodies against ATP1, ATP2, COX2, COXVc, COB, CYTc1, NAD9, and the 76-kD subunit of complex I. (C) Quantitation of the proteins on the two-dimensional gels and protein gel blots. The intensities of the stained spots were analyzed with the Z3 proteome analysis software (Compugen, Tel-Aviv, Israel), averaged for the three protein loadings, and expressed as histograms of ppm of the overall intensity. The values obtained were averaged for three independent experiments, with error bars representing the standard deviation.
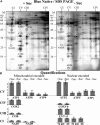
Figure 5.
The Relative Stoichiometry and Protein Subunit Composition of Major Enzyme Complexes of the Inner Mitochondrial Membrane Are Unaffected by Starvation. Mitochondria were isolated from cultures grown for 19 h plus (+ Suc) or minus (− Suc) sucrose and fractionated by Blue-Native gels in the first dimension and SDS-denaturing gels in the second dimension to resolve proteins from respiratory complexes I to V (A). The spot intensities of seven mitochondrially encoded and seven nuclear-encoded proteins from complexes I to V were quantified with the Z3 proteome analysis software (Compugen), expressed as ppm of the overall intensity, and averaged for three replicate gels. Error bars show the standard deviation between the gels (B).
Figure 6.
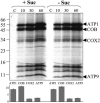
There Is No Difference in the Capacity for in Organello Protein Synthesis by Mitochondria Isolated from Control and Sucrose-Starved Arabidopsis Cell Cultures. Autoradiogram of proteins synthesized in organello for 10, 30, and 60 min by mitochondria isolated from 19 h plus (+ Suc) or minus (− Suc) sucrose cultures and fractionated on 12% (w/v) PAGE. Lanes marked with a C are bacterial contamination controls where sodium acetate was used as an energy source. Proteins are identified according to their calculated molecular weight. The histogram shows the quantification with the Z3 proteome analysis software (Compugen) of the four identified proteins, expressed as ppm of the overall intensity, in plus sucrose and minus sucrose experiments. The average for the three different time points averaged for three independent experiments is represented, with standard deviations as error bars.
Figure 7.
The Capacity for in Vitro Mitochondrial Protein Import Is Not Impaired in Mitochondria Isolated from Sucrose-Starved Arabidopsis Cell Cultures. (A) In vitro–synthesized, 35S-labeled, fusion protein between the nucleotide sequence of ATP2 and GFP (translation) was incubated with mitochondria isolated from 19 h plus (+ Suc) or minus (− Suc) sucrose cultures for 10, 30, and 60 min. Experiments were also performed in the presence (+) or absence (−) of Proteinase K (10 units/mg proteins for 30 min), Valinomycin (50 pM), and Triton X-100 (0.1%) reisolated, fractionated on 15% (w/v) PAGE, dried, and autoradiographed. The 36-kD in vitro–synthesized precursor protein is indicated by a black arrow, the 27-kD imported protein product by a gray arrow. (B) Quantitation with the Z3 proteome analysis software (Compugen) of the 27-kD imported protein, expressed as ppm of the overall intensity. The histogram shows the average for three independent experiments, with standard deviation as error bars.
Similar articles
- Mitochondrial CLPP2 Assists Coordination and Homeostasis of Respiratory Complexes.
Petereit J, Duncan O, Murcha MW, Fenske R, Cincu E, Cahn J, Pružinská A, Ivanova A, Kollipara L, Wortelkamp S, Sickmann A, Lee J, Lister R, Millar AH, Huang S. Petereit J, et al. Plant Physiol. 2020 Sep;184(1):148-164. doi: 10.1104/pp.20.00136. Epub 2020 Jun 22. Plant Physiol. 2020. PMID: 32571844 Free PMC article. - Plant mitochondria contain the protein translocase subunits TatB and TatC.
Carrie C, Weißenberger S, Soll J. Carrie C, et al. J Cell Sci. 2016 Oct 15;129(20):3935-3947. doi: 10.1242/jcs.190975. Epub 2016 Sep 8. J Cell Sci. 2016. PMID: 27609835 - Silencing of the nuclear RPS10 gene encoding mitochondrial ribosomal protein alters translation in arabidopsis mitochondria.
Kwasniak M, Majewski P, Skibior R, Adamowicz A, Czarna M, Sliwinska E, Janska H. Kwasniak M, et al. Plant Cell. 2013 May;25(5):1855-67. doi: 10.1105/tpc.113.111294. Epub 2013 May 30. Plant Cell. 2013. PMID: 23723321 Free PMC article. - Transcription signals of mitochondrial and nuclear genes for mitochondrial proteins in dicot plants.
Brennicke A, Zabaleta E, Dombrowski S, Hoffmann M, Binder S. Brennicke A, et al. J Hered. 1999 May-Jun;90(3):345-50. doi: 10.1093/jhered/90.3.345. J Hered. 1999. PMID: 10355120 Review. - Surrogate mutants for studying mitochondrially encoded functions.
Colas des Francs-Small C, Small I. Colas des Francs-Small C, et al. Biochimie. 2014 May;100:234-42. doi: 10.1016/j.biochi.2013.08.019. Epub 2013 Aug 29. Biochimie. 2014. PMID: 23994752 Review.
Cited by
- Cytonuclear evolution in fully heterotrophic plants: lifestyles and gene function determine scenarios.
Guo X, Wang H, Lin D, Wang Y, Jin X. Guo X, et al. BMC Plant Biol. 2024 Oct 21;24(1):989. doi: 10.1186/s12870-024-05702-4. BMC Plant Biol. 2024. PMID: 39428472 Free PMC article. - Overexpression of RPOTmp Being Targeted to Either Mitochondria or Chloroplasts in Arabidopsis Leads to Overall Transcriptome Changes and Faster Growth.
Gorbenko IV, Tarasenko VI, Garnik EY, Yakovleva TV, Katyshev AI, Belkov VI, Orlov YL, Konstantinov YM, Koulintchenko MV. Gorbenko IV, et al. Int J Mol Sci. 2024 Jul 26;25(15):8164. doi: 10.3390/ijms25158164. Int J Mol Sci. 2024. PMID: 39125738 Free PMC article. - Experimental approaches to studying translation in plant semi-autonomous organelles.
Kwasniak-Owczarek M, Janska H. Kwasniak-Owczarek M, et al. J Exp Bot. 2024 Sep 11;75(17):5175-5187. doi: 10.1093/jxb/erae151. J Exp Bot. 2024. PMID: 38592734 Free PMC article. Review. - The P-type pentatricopeptide repeat protein DWEORG1 is a non-previously reported rPPR protein of Arabidopsis mitochondria.
Grüttner S, Nguyen TT, Bruhs A, Mireau H, Kempken F. Grüttner S, et al. Sci Rep. 2022 Jul 21;12(1):12492. doi: 10.1038/s41598-022-16812-0. Sci Rep. 2022. PMID: 35864185 Free PMC article. - Assessment of Protein Synthesis in Mitochondria Isolated from Rosette Leaves and Liquid Culture Seedlings of Arabidopsis.
Kwasniak-Owczarek M, Tomal A, Janska H. Kwasniak-Owczarek M, et al. Methods Mol Biol. 2022;2363:183-197. doi: 10.1007/978-1-0716-1653-6_14. Methods Mol Biol. 2022. PMID: 34545494
References
- Benjamini, Y., and Hochberg, Y. (1995). Controlling the false discovery rate: A practical and powerful approach to multiple testing. J. R. Stat. Soc. Series B 57, 289–300.
- Braun, H.P., and Schmitz, U.K. (1999). The protein-import apparatus of plant mitochondria. Planta 209, 267–274. - PubMed
- Brumme, S., Kruft, V., Schmitz, U.K., and Braun, H.P. (1998). New insights into the co-evolution of cytochrome c reductase and the mitochondrial processing peptidase. J. Biol. Chem. 273, 13143–13149. - PubMed
Publication types
MeSH terms
Substances
LinkOut - more resources
Full Text Sources
Molecular Biology Databases
