Discovering statistically significant pathways in expression profiling studies - PubMed (original) (raw)
Discovering statistically significant pathways in expression profiling studies
Lu Tian et al. Proc Natl Acad Sci U S A. 2005.
Abstract
Accurate and rapid identification of perturbed pathways through the analysis of genome-wide expression profiles facilitates the generation of biological hypotheses. We propose a statistical framework for determining whether a specified group of genes for a pathway has a coordinated association with a phenotype of interest. Several issues on proper hypothesis-testing procedures are clarified. In particular, it is shown that the differences in the correlation structure of each set of genes can lead to a biased comparison among gene sets unless a normalization procedure is applied. We propose statistical tests for two important but different aspects of association for each group of genes. This approach has more statistical power than currently available methods and can result in the discovery of statistically significant pathways that are not detected by other methods. This method is applied to data sets involving diabetes, inflammatory myopathies, and Alzheimer's disease, using gene sets we compiled from various public databases. In the case of inflammatory myopathies, we have correctly identified the known cytotoxic T lymphocyte-mediated autoimmunity in inclusion body myositis. Furthermore, we predicted the presence of dendritic cells in inclusion body myositis and of an IFN-alpha/beta response in dermatomyositis, neither of which was previously described. These predictions have been subsequently corroborated by immunohistochemistry.
Figures
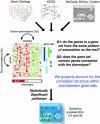
Fig. 1.
Outline of the methodology. An extensive collection of pathway information is assembled from various databases; a statistical test is applied to find relationships between the expression levels and the phenotype, and then two different testing procedures are used to find statistically significant pathways. Proper adjustments for correlation structure and multiple testing are critical.
Fig. 2.
A scatterplot of the SDs of null distributions for the ES vs. the observed ES for the diabetes data. Each point represents a gene set. The Pearson correlation coefficient is 0.55. Without proper normalization among different gene sets, a high score may be due to its wide null distribution, which depends on the size and correlation structure of the gene set.
Similar articles
- A gene expression approach to study perturbed pathways in myositis.
Greenberg SA. Greenberg SA. Curr Opin Rheumatol. 2007 Nov;19(6):536-41. doi: 10.1097/BOR.0b013e3282efe261. Curr Opin Rheumatol. 2007. PMID: 17917532 Review. - Interferon-alpha/beta-mediated innate immune mechanisms in dermatomyositis.
Greenberg SA, Pinkus JL, Pinkus GS, Burleson T, Sanoudou D, Tawil R, Barohn RJ, Saperstein DS, Briemberg HR, Ericsson M, Park P, Amato AA. Greenberg SA, et al. Ann Neurol. 2005 May;57(5):664-78. doi: 10.1002/ana.20464. Ann Neurol. 2005. PMID: 15852401 - Localization of the alpha-chemokine SDF-1 and its receptor CXCR4 in idiopathic inflammatory myopathies.
De Paepe B, Schröder JM, Martin JJ, Racz GZ, De Bleecker JL. De Paepe B, et al. Neuromuscul Disord. 2004 Apr;14(4):265-73. doi: 10.1016/j.nmd.2004.01.001. Neuromuscul Disord. 2004. PMID: 15019705 - Altered RIG-I/DDX58-mediated innate immunity in dermatomyositis.
Suárez-Calvet X, Gallardo E, Nogales-Gadea G, Querol L, Navas M, Díaz-Manera J, Rojas-Garcia R, Illa I. Suárez-Calvet X, et al. J Pathol. 2014 Jul;233(3):258-68. doi: 10.1002/path.4346. Epub 2014 Apr 29. J Pathol. 2014. PMID: 24604766 - Idiopathic inflammatory myopathies: from immunopathogenesis to new therapeutic targets.
Haq SA, Tournadre A. Haq SA, et al. Int J Rheum Dis. 2015 Nov;18(8):818-25. doi: 10.1111/1756-185X.12736. Epub 2015 Sep 19. Int J Rheum Dis. 2015. PMID: 26385431 Review.
Cited by
- Does pathway analysis make it easier for common variants to tag rare ones?
Uh HW, Tsonaka R, Houwing-Duistermaat JJ. Uh HW, et al. BMC Proc. 2011 Nov 29;5 Suppl 9(Suppl 9):S90. doi: 10.1186/1753-6561-5-S9-S90. BMC Proc. 2011. PMID: 22373113 Free PMC article. - Harnessing the complexity of gene expression data from cancer: from single gene to structural pathway methods.
Emmert-Streib F, Tripathi S, de Matos Simoes R. Emmert-Streib F, et al. Biol Direct. 2012 Dec 10;7:44. doi: 10.1186/1745-6150-7-44. Biol Direct. 2012. PMID: 23227854 Free PMC article. Review. - Gene set analysis using variance component tests.
Huang YT, Lin X. Huang YT, et al. BMC Bioinformatics. 2013 Jun 28;14:210. doi: 10.1186/1471-2105-14-210. BMC Bioinformatics. 2013. PMID: 23806107 Free PMC article. - Transcript-level annotation of Affymetrix probesets improves the interpretation of gene expression data.
Yu H, Wang F, Tu K, Xie L, Li YY, Li YX. Yu H, et al. BMC Bioinformatics. 2007 Jun 11;8:194. doi: 10.1186/1471-2105-8-194. BMC Bioinformatics. 2007. PMID: 17559689 Free PMC article. - Personalized Prediction of Acquired Resistance to EGFR-Targeted Inhibitors Using a Pathway-Based Machine Learning Approach.
Kim YR, Kim YW, Lee SE, Yang HW, Kim SY. Kim YR, et al. Cancers (Basel). 2019 Jan 4;11(1):45. doi: 10.3390/cancers11010045. Cancers (Basel). 2019. PMID: 30621238 Free PMC article.
References
- Speed, T., ed. (2003) Statistical Analysis of Gene Expression Microarray Data (Chapman & Hall/CRC, Boca Raton, FL).
- Pavlidis, P., Li, Q. & Noble, W. S. (2003) Bioinformatics 19, 1620-1627. - PubMed
- Dahlquist, K. D., Salomonis, N., Vranizan, K., Lawlor, S. C. & Conklin, B. R. (2002) Nat. Genet. 31, 19-20. - PubMed
Publication types
MeSH terms
Substances
LinkOut - more resources
Full Text Sources
Other Literature Sources

