Signal processing in the TGF-beta superfamily ligand-receptor network - PubMed (original) (raw)
Signal processing in the TGF-beta superfamily ligand-receptor network
Jose M G Vilar et al. PLoS Comput Biol. 2006 Jan.
Abstract
The TGF-beta pathway plays a central role in tissue homeostasis and morphogenesis. It transduces a variety of extracellular signals into intracellular transcriptional responses that control a plethora of cellular processes, including cell growth, apoptosis, and differentiation. We use computational modeling to show that coupling of signaling with receptor trafficking results in a highly versatile signal-processing unit, able to sense by itself absolute levels of ligand, temporal changes in ligand concentration, and ratios of multiple ligands. This coupling controls whether the response of the receptor module is transient or permanent and whether or not different signaling channels behave independently of each other. Our computational approach unifies seemingly disparate experimental observations and suggests specific changes in receptor trafficking patterns that can lead to phenotypes that favor tumor progression.
Conflict of interest statement
Competing interests. The authors have declared that no competing interests exist.
Figures
Figure 1. Formation of Receptor Hetero-Tetramers
The active form of the TGF-β ligand is a dimer of two molecules held together by hydrophobic interactions and a disulfide bond [30,31]. This dimer induces the formation, at the plasma membrane, of receptor hetero-tetramers that contain two type I and two type II receptors [2,3]. The type II receptors phosphorylate the type I receptors; the type I receptors are then enabled to phosphorylate cytoplasmic R-Smads, which then act as transcriptional regulators.
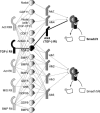
Figure 2. Interactions among the Ligands of the TGF-β Superfamily and Their Receptors
The graphical representation lays out the specific type II/type I receptor complexes that different ligands mediate (based on data reviewed in reference [32]). Each set of links drawn between a type II and type I receptor, mediated by a connecting ligand, represents a feasible ligand-receptor complex. The 14 ligands, 5 type II and 7 type I receptors shown here give rise to 50 different combinations of ligand-receptor complexes overall. Note that many of these 50 complexes share ligand and receptor species. The ligand-receptor complexes phosporylate the cytoplasmic R-Smads; at this point the signal is essentially funneled into two different pathways. The decision of which one is chosen depends on the particular type I receptor in the ligand-receptor complex. The type I receptors can be divided into two groups, depending on which subgroup of R-Smads they bind and phosphorylate: the first group of type I receptors (Alk1/2/3/6, shown on the bottom right) bind and activate the R-Smads Smad1/5/8, whereas the second group (Alk4/5/7, shown on the top right) act on the R-Smads Smad2/3. The phosphorylated R-Smads then form complexes with the Co-Smad Smad4.
Figure 3. Signaling and Trafficking in the TGF-β Pathway
Receptors in the plasma membrane interact with the signaling peptides of the TGF-β superfamily to form active complexes. Receptors and activated ligand-receptor complexes can internalize via clathrin-coated pits into endosomes, from where the active ligand-receptor complexes phosphorylate the cytoplasmic R-Smads (“receptor Smads,” either the Smad1/5/8 or the Smad2/3 group) [33]. The phosphorylated R-Smads form complexes with the Co-Smad (Smad4) and then translocate into the nucleus where they act as transcriptional regulators of about 300 target genes. The internalized receptors recycle back to the plasma membrane (with a characteristic time of ~30 min) via a rab11-dependent, rab4-independent pathway [14]. After returning to the plasma membrane, the receptors that were actively signaling can be targeted for degradation or be used for further ligand-binding or internalization [14]. Receptors that did not bind ligands are simply returned to the plasma membrane. As a consequence of the trafficking processes, only about 5%–10% of receptors are present in the plasma membrane [15]. In addition to the traditional clathrin pathway, active ligand-receptor complexes can recruit Smad7-Smurf2 [28], which then targets them to lipid raft–caveolar compartments (right) for degradation [15]. The ligands do not return back to the plasma membrane, but disassociate from the receptors before recycling and undergo direct degradation via the lysosomes [14]. Note that, in addition to the ligand-induced receptor degradation, we also consider a receptor degradation pathway that functions independently of ligand-binding; this represents a “constitutive” or ligand-independent degradation pathway (left).
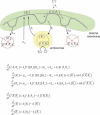
Figure 4. Two-Compartment Model of Receptor Trafficking and Signaling
Graphical representation and equations for a model with one ligand that forms complexes with one type I and one type II receptor. Receptors are present in two main compartments: the plasma membrane (receptors at the cell surface) and the endosomes (internalized receptors). Receptors and ligand-receptor complexes traffic between these two compartments by internalization and recycling. Only internalized ligand-bound receptors have kinase activity. Active receptors can also be internalized in a degradation pathway (right). In addition, receptors in the plasma membrane can undergo constitutive degradation, independently of whether they are ligand-bound (left). A supply of new receptors is constantly produced by gene expression. The concentration of the ligand is denoted by [ l ]; the numbers of type I and II receptor and ligand-receptor complexes in the plasma membrane, by [_RI_], [_RII_], and [_l RIRII_], respectively; and the numbers of internalized type I and II receptor and ligand-receptor complexes by [
RI
], [
RII
], and [
l RIRII
], respectively. (Note that type II receptors are not shown in the graphical representation.) kα is the rate constant of ligand-receptor complex formation; pRI and pRII are the rates of receptor production; ki, kr, kcd, and klid are the internalization, recycling, constitutive degradation, and ligand-induced degradation rate constants; α is the fraction of active receptors that are recycled back to the plasma membrane and can interact again with the ligand. The signaling activity of the pathway is assumed to be proportional to the number of internalized ligand-receptor complexes, [
lRIRII
]. This assumption is based on the observations that R-Smad proteins become rapidly dephosphorylated after inhibition of the receptor kinase activity and that nuclear Smad localization closely follows Smad phosphorylation [16].
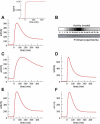
Figure 5. Typical Time Courses of the Number of Active Receptor Complexes upon Addition of TGF-β
The typical response to sustained changes in TGF-β concentration shows partial adaptation after reaching a maximum of activity. Different values of the parameters of the model lead to this characteristic behavior. In all panels, the TGF-β concentration is increased at time 0 to saturating values and kept constant afterward, as in inset in (A). (A) Behavior of the model for typical trafficking rates: internalization, ki = (3 min)−1; recycling, kr = (30 min)−1; constitutive degradation, kcd = (36 min)−1; ligand-induced degradation klid = (4 min)−1; efficiency of recycling of active receptors, α = 1. Note that the trafficking rate constants are given as the inverse of the corresponding characteristic times. The production of receptors is chosen to be pRI = 8 min−1 and pRII = 4 min−1, which leads to ~103 receptors per cell under stationary conditions in the absence of ligand. The units of ligand concentration are chosen so that the association rate constant is the unit, ka = 1. For these units, EC50 ≈ 2 × 10⁻⁴. At time 0, the ligand concentration changes from 3×10⁻⁵ to 0.01. The signal peaks at ~60 min. (B) Comparison of the model time course (upper lane) with an experimental time course of nuclear phosphorylated Smad2 (P-Smad) as reported by Inman et al. (bottom lane) [16]. The model results from (A) are shown at the experimental time points and color-coded to ease comparison. (C) Behavior of the model with the same parameter values as in (A), with the exception of the rate constants for internalization and recycling that have been decreased to ki = (10 min)−1 and kr = (100 min)−1. The signal peaks at ~180 min. (D) Behavior of the model with the same parameter values as in (A), with the exception of the rate constants for internalization and recycling that have been increased to ki = (1 min)−1 and kr = (10 min)−1. The signal peaks at ~20 min. (E) Behavior of the model with the same parameter values as in (A), with the exception of the rate constant for ligand-induced degradation that has been decreased to klid = 0 and the efficiency of recycling of active receptors that has been decreased to α = 0.5. This implies that ligand-receptor complexes are not degraded via the caveolae pathway. In contrast, 50% of the active ligand-receptors that come back to the plasma membrane after they have signaled are degraded. (F) Behavior of the model with the same parameter values as in (A), with the exception of the efficiency of recycling of active receptors that has been decreased to α = 0.5. These parameters account for both types (caveola-dependent and recycling-dependent) of ligand-induced degradation.
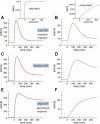
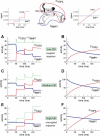
Figure 6. Control of the Kinetic Signaling Behavior
A key control quantity of the qualitative behavior of the system is the CIR. Panels on the left (A, C, and E) show the typical behavior of the system for different CIR values. The TGF-β concentration is increased at time 0 to saturating values and remains constant afterward, (A) inset. Panels on the right (B, D, and F) show the behavior of the system for the same parameter values as the corresponding panels on the left but when TGF-β concentration is increased slowly, (B) inset. (A and B) Same parameter values as in Figure 5A with the exception that the constitutive and ligand-induced degradation rates have been decreased and increased by a factor three, respectively: kcd = (3 × 36 min)−1; ligand-induced degradation klid = (4/3 min)−1. (C and D) Same parameter values as in Figure 5A. Figure in (C) is exactly the same as Figure 5A. (E and F) Same parameter values as in Figure 5A with the exception that the constitutive and ligand-induced degradation rates have been increased and decreased by a factor three, respectively: kcd = (36/3 min)−1; ligand-induced degradation klid = (3 × 4 min)−1.
Figure 7. Control of Signal Integration
Time courses of the numbers of active receptor complexes when TGF-β concentration (in red) is increased, repeatedly in steps or continuously. Left panels (A, C, and E) show the responses to step increases as shown in inset in (A). Right panels (B, D, and F) show the response to a continuous increase as shown in inset in (B). There is also a second ligand present (here BMP7, in blue) whose concentration is kept constant. The two ligands induce the formation of two ligand-receptor complexes, CBMP7 (blue) and CTGF-β (red), that share the type I receptor Alk2. The green line on the left panels shows the total number of active receptor complexes (CBMP7 + CTGF−β). As in Figure 6, a key control quantity of the qualitative behavior of the system is the CIR. The parameter values for (A–F) are the same as in Figure 6A–6F, respectively.
Similar articles
- New regulatory mechanisms of TGF-beta receptor function.
Kang JS, Liu C, Derynck R. Kang JS, et al. Trends Cell Biol. 2009 Aug;19(8):385-94. doi: 10.1016/j.tcb.2009.05.008. Epub 2009 Aug 3. Trends Cell Biol. 2009. PMID: 19648010 Review. - The effect of FK506 on transforming growth factor beta signaling and apoptosis in chronic lymphocytic leukemia B cells.
Romano S, Mallardo M, Chiurazzi F, Bisogni R, D'Angelillo A, Liuzzi R, Compare G, Romano MF. Romano S, et al. Haematologica. 2008 Jul;93(7):1039-48. doi: 10.3324/haematol.12402. Epub 2008 May 19. Haematologica. 2008. PMID: 18492692 - TGF-beta and atherosclerosis in man.
Grainger DJ. Grainger DJ. Cardiovasc Res. 2007 May 1;74(2):213-22. doi: 10.1016/j.cardiores.2007.02.022. Epub 2007 Feb 23. Cardiovasc Res. 2007. PMID: 17382916 Review. - Alterations in components of the TGF-beta superfamily signaling pathways in human cancer.
Levy L, Hill CS. Levy L, et al. Cytokine Growth Factor Rev. 2006 Feb-Apr;17(1-2):41-58. doi: 10.1016/j.cytogfr.2005.09.009. Epub 2005 Nov 23. Cytokine Growth Factor Rev. 2006. PMID: 16310402 Review. - Single-molecule force spectroscopy study of interaction between transforming growth factor beta1 and its receptor in living cells.
Yu J, Wang Q, Shi X, Ma X, Yang H, Chen YG, Fang X. Yu J, et al. J Phys Chem B. 2007 Dec 6;111(48):13619-25. doi: 10.1021/jp0758667. Epub 2007 Nov 13. J Phys Chem B. 2007. PMID: 17997544
Cited by
- Type II transforming growth factor-beta receptor recycling is dependent upon the clathrin adaptor protein Dab2.
Penheiter SG, Singh RD, Repellin CE, Wilkes MC, Edens M, Howe PH, Pagano RE, Leof EB. Penheiter SG, et al. Mol Biol Cell. 2010 Nov 15;21(22):4009-19. doi: 10.1091/mbc.E09-12-1019. Epub 2010 Sep 29. Mol Biol Cell. 2010. PMID: 20881059 Free PMC article. - Endocytosis and signalling: a meeting with mathematics.
Birtwistle MR, Kholodenko BN. Birtwistle MR, et al. Mol Oncol. 2009 Aug;3(4):308-20. doi: 10.1016/j.molonc.2009.05.009. Epub 2009 Jun 16. Mol Oncol. 2009. PMID: 19596615 Free PMC article. Review. - First-in-human study of GFH018, a small molecule inhibitor of transforming growth factor-β receptor I inhibitor, in patients with advanced solid tumors.
Guo Y, Wang Z, Zhou H, Pan H, Han W, Deng Y, Li Q, Xue J, Ge X, Wang S, Wang J, Zhang Y, Zhao C, Zhu H, Wang Y, Shen H, Liu D, Li J. Guo Y, et al. BMC Cancer. 2024 Apr 10;24(1):444. doi: 10.1186/s12885-024-12216-7. BMC Cancer. 2024. PMID: 38600507 Free PMC article. - Computational modelling of Smad-mediated negative feedback and crosstalk in the TGF-β superfamily network.
Nicklas D, Saiz L. Nicklas D, et al. J R Soc Interface. 2013 Jun 26;10(86):20130363. doi: 10.1098/rsif.2013.0363. Print 2013 Sep 6. J R Soc Interface. 2013. PMID: 23804438 Free PMC article. - In silico investigation of ADAM12 effect on TGF-beta receptors trafficking.
Gruel J, Leborgne M, LeMeur N, Théret N. Gruel J, et al. BMC Res Notes. 2009 Sep 24;2:193. doi: 10.1186/1756-0500-2-193. BMC Res Notes. 2009. PMID: 19778441 Free PMC article.
References
- Kang Y, Siegel PM, Shu W, Drobnjak M, Kakonen SM, et al. A multigenic program mediating breast cancer metastasis to bone. Cancer Cell. 2003;3:537–549. - PubMed
- Yamashita H, ten Dijke P, Franzen P, Miyazono K, Heldin CH. Formation of hetero-oligomeric complexes of type I and type II receptors for transforming growth factor-beta. J Biol Chem. 1994;269:20172–20178. - PubMed
- Goumans MJ, Valdimarsdottir G, Itoh S, Lebrin F, Larsson J, et al. Activin receptor-like kinase (ALK)1 is an antagonistic mediator of lateral TGFbeta/ALK5 signaling. Mol Cell. 2003;12:817–828. - PubMed
- Siegel PM, Massague J. Cytostatic and apoptotic actions of TGF-beta in homeostasis and cancer. Nat Rev Cancer. 2003;3:807–821. - PubMed
- Cui W, Fowlis DJ, Bryson S, Duffie E, Ireland H, et al. TGFbeta1 inhibits the formation of benign skin tumors, but enhances progression to invasive spindle carcinomas in transgenic mice. Cell. 1996;86:531–542. - PubMed
Publication types
MeSH terms
Substances
LinkOut - more resources
Full Text Sources
Other Literature Sources
Molecular Biology Databases

