A simple and robust statistical test for detecting the presence of recombination - PubMed (original) (raw)
A simple and robust statistical test for detecting the presence of recombination
Trevor C Bruen et al. Genetics. 2006 Apr.
Abstract
Recombination is a powerful evolutionary force that merges historically distinct genotypes. But the extent of recombination within many organisms is unknown, and even determining its presence within a set of homologous sequences is a difficult question. Here we develop a new statistic, phi(w), that can be used to test for recombination. We show through simulation that our test can discriminate effectively between the presence and absence of recombination, even in diverse situations such as exponential growth (star-like topologies) and patterns of substitution rate correlation. A number of other tests, Max chi2, NSS, a coalescent-based likelihood permutation test (from LDHat), and correlation of linkage disequilibrium (both r2 and /D'/) with distance, all tend to underestimate the presence of recombination under strong population growth. Moreover, both Max chi2 and NSS falsely infer the presence of recombination under a simple model of mutation rate correlation. Results on empirical data show that our test can be used to detect recombination between closely as well as distantly related samples, regardless of the suspected rate of recombination. The results suggest that phi(w) is one of the best approaches to distinguish recurrent mutation from recombination in a wide variety of circumstances.
Figures
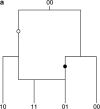
Figure 1.
The dual nature of incompatibility. Two possible histories for a pair of incompatible sites are shown: (a) two incompatible sites explained by a recombination event and (b) two incompatible sites explained by a convergent mutation. Mutations in the first site are indicated by open circles and mutations in the second site are indicated by solid circles. To explain the incompatibility between the pair of sites either a recombination event must be invoked or a homoplasy must have occurred in the history of one of the sites.
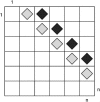
Figure 2.
The entries marked with a diamond in the refined incompatibility matrix represent the cells used to calculate the pairwise homoplasy index (or Φ_w_). The cells with light shading contain the refined incompatibility score of informative site i with informative site i + 1. The cells with dark shading contain the refined incompatibility score of informative site i with informative site i + 2. In this example sites up to 2 informative bases apart are used to calculate Φ_w_.
Figure 3.
Comparison of _P_-values obtained using the permutation test (horizontal axis) to analytical _P_-values (vertical axis) when ρ = 0 and β = 0. Points with <15 samples and <10% sequence divergence are not shown (see Table 2).
Figure 4.
Power to detect recombination for (a) m = 10 and (b) m = 50 samples for six different methods with (a and b, bottom rows) and without (a and b, top rows) population growth. The horizontal axis varies the rate of recombination whereas the vertical axis varies the amount of sequence diversity. Each cell represents the outcome of 1000 replicates with cells with lighter shading indicating increased power. The value ρ† refers to the value of ρ used to give the same expected number of recombinations under population growth.
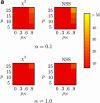
Figure 5.
Percentage of false positives for (a) m = 10 samples (with β = 5000), (b) m = 50 samples (with β = 0), and (c) m = 50 samples (with β = 5000), for Max χ2 and NSS, with extreme rate heterogeneity (top row) and moderate rate heterogeneity (bottom row). The horizontal axis varies the substitution rate correlation whereas the vertical axis varies the amount of sequence diversity. Each cell represents the outcome of 1000 replicates with cells with lighter shading indicating a higher percentage of false positives. The results for Φ_w_, _r_2, and |D_′| are omitted since these approaches did not falsely infer recombination >7% of the time for any of the conditions, but Table 4 shows a number of these results for Φ_w.
Figure 6.
Distribution of _P_-values inferred by the Φ_w_-statistic, the NSS statistic, and the Max χ2-statistic. The results are obtained on the basis of 1000 parametric bootstraps under conditions observed for the Boletales example. None of the replicates contained recombination but the substitution rate autocorrelation was set to ρN = 0.35 and substitution rate heterogeneity was set to α = 1.31.
Similar articles
- Recombination estimation under complex evolutionary models with the coalescent composite-likelihood method.
Carvajal-Rodríguez A, Crandall KA, Posada D. Carvajal-Rodríguez A, et al. Mol Biol Evol. 2006 Apr;23(4):817-27. doi: 10.1093/molbev/msj102. Epub 2006 Feb 1. Mol Biol Evol. 2006. PMID: 16452117 Free PMC article. - A coalescent-based method for detecting and estimating recombination from gene sequences.
McVean G, Awadalla P, Fearnhead P. McVean G, et al. Genetics. 2002 Mar;160(3):1231-41. doi: 10.1093/genetics/160.3.1231. Genetics. 2002. PMID: 11901136 Free PMC article. - Critical assessment of coalescent simulators in modeling recombination hotspots in genomic sequences.
Yang T, Deng HW, Niu T. Yang T, et al. BMC Bioinformatics. 2014 Jan 3;15:3. doi: 10.1186/1471-2105-15-3. BMC Bioinformatics. 2014. PMID: 24387001 Free PMC article. - On selecting markers for association studies: patterns of linkage disequilibrium between two and three diallelic loci.
Garner C, Slatkin M. Garner C, et al. Genet Epidemiol. 2003 Jan;24(1):57-67. doi: 10.1002/gepi.10217. Genet Epidemiol. 2003. PMID: 12508256 Review. - Linkage disequilibrium: ancient history drives the new genetics.
Abecasis GR, Ghosh D, Nichols TE. Abecasis GR, et al. Hum Hered. 2005;59(2):118-24. doi: 10.1159/000085226. Epub 2005 Apr 18. Hum Hered. 2005. PMID: 15838181 Review.
Cited by
- Population structure of clinical and environmental Vibrio parahaemolyticus from the Pacific Northwest coast of the United States.
Turner JW, Paranjpye RN, Landis ED, Biryukov SV, González-Escalona N, Nilsson WB, Strom MS. Turner JW, et al. PLoS One. 2013;8(2):e55726. doi: 10.1371/journal.pone.0055726. Epub 2013 Feb 7. PLoS One. 2013. PMID: 23409028 Free PMC article. - Limited role of recombination in the global diversification of begomovirus DNA-B proteins.
Dubey D, Hoyer JS, Duffy S. Dubey D, et al. Virus Res. 2023 Jan 2;323:198959. doi: 10.1016/j.virusres.2022.198959. Epub 2022 Oct 6. Virus Res. 2023. PMID: 36209920 Free PMC article. - Genome characterisation of the genus Francisella reveals insight into similar evolutionary paths in pathogens of mammals and fish.
Sjödin A, Svensson K, Ohrman C, Ahlinder J, Lindgren P, Duodu S, Johansson A, Colquhoun DJ, Larsson P, Forsman M. Sjödin A, et al. BMC Genomics. 2012 Jun 22;13:268. doi: 10.1186/1471-2164-13-268. BMC Genomics. 2012. PMID: 22727144 Free PMC article. - Whole-genome analysis of diverse Chlamydia trachomatis strains identifies phylogenetic relationships masked by current clinical typing.
Harris SR, Clarke IN, Seth-Smith HM, Solomon AW, Cutcliffe LT, Marsh P, Skilton RJ, Holland MJ, Mabey D, Peeling RW, Lewis DA, Spratt BG, Unemo M, Persson K, Bjartling C, Brunham R, de Vries HJ, Morré SA, Speksnijder A, Bébéar CM, Clerc M, de Barbeyrac B, Parkhill J, Thomson NR. Harris SR, et al. Nat Genet. 2012 Mar 11;44(4):413-9, S1. doi: 10.1038/ng.2214. Nat Genet. 2012. PMID: 22406642 Free PMC article. - Defining the phylogenomics of Shigella species: a pathway to diagnostics.
Sahl JW, Morris CR, Emberger J, Fraser CM, Ochieng JB, Juma J, Fields B, Breiman RF, Gilmour M, Nataro JP, Rasko DA. Sahl JW, et al. J Clin Microbiol. 2015 Mar;53(3):951-60. doi: 10.1128/JCM.03527-14. Epub 2015 Jan 14. J Clin Microbiol. 2015. PMID: 25588655 Free PMC article.
References
- Awadalla, P., 2003. The evolutionary genomics of pathogen recombination. Nat. Rev. Genet. 4(1): 50–60. - PubMed
- Awadalla, P., A. Eyre-Walker and J. M. Smith, 1999. Linkage disequilibrium and recombination in hominid mitochondrial DNA. Science 286(5449): 2524–2525. - PubMed
- Brown, C. J., E. C. Garner, A. Keith Dunker and P. Joyce, 2001. The power to detect recombination using the coalescent. Mol. Biol. Evol. 18(7): 1421–1424. - PubMed
- Bruen, T., and D. Bryant, 2006. A subdivision approach to maximum parsimony. Ann. Combinator. (in press).
Publication types
MeSH terms
LinkOut - more resources
Full Text Sources


