Hybridization interactions between probesets in short oligo microarrays lead to spurious correlations - PubMed (original) (raw)
Hybridization interactions between probesets in short oligo microarrays lead to spurious correlations
Michał J Okoniewski et al. BMC Bioinformatics. 2006.
Abstract
Background: Microarrays measure the binding of nucleotide sequences to a set of sequence specific probes. This information is combined with annotation specifying the relationship between probes and targets and used to make inferences about transcript- and, ultimately, gene expression. In some situations, a probe is capable of hybridizing to more than one transcript, in others, multiple probes can target a single sequence. These 'multiply targeted' probes can result in non-independence between measured expression levels.
Results: An analysis of these relationships for Affymetrix arrays considered both the extent and influence of exact matches between probe and transcript sequences. For the popular HGU133A array, approximately half of the probesets were found to interact in this way. Both real and simulated expression datasets were used to examine how these effects influenced the expression signal. It was found not only to lead to increased signal strength for the affected probesets, but the major effect is to significantly increase their correlation, even in situations when only a single probe from a probeset was involved. By building a network of probe-probeset-transcript relationships, it is possible to identify families of interacting probesets. More than 10% of the families contain members annotated to different genes or even different Unigene clusters. Within a family, a mixture of genuine biological and artefactual correlations can occur.
Conclusion: Multiple targeting is not only prevalent, but also significant. The ability of probesets to hybridize to more than one gene product can lead to false positives when analysing gene expression. Comprehensive annotation describing multiple targeting is required when interpreting array data.
Figures
Figure 1
MT motifs. The basic motifs of multiple targeting. a) PTP motif b) TPT motif c) a simple combination of both – PTPTP motif. The motifs form the basic building blocks of multiple targeting networks. The strength of relationship between a transcript and a probeset is dependent on the number of probes matching to the transcript.
Figure 2
LGL graph of MT. a) LGL graph of all probeset-transcript relationships in HG_U133A array b) and c) are close-up views of regions in a)
Figure 3
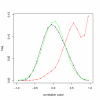
Influence of MT on correlation between probesets. The distribution of Pearson correlation for all probeset pairs (black) vs. MT probeset pairs (red). Data from 50 arrays from Gene Atlas processed with RMA. The global (black) curve represents correlation for 1 million random probeset pairs, while the MT curve (red) was drawn using all probeset pairs from over 110,000 PTP motifs that occur in the HG_U133A array. The peak of the MT curve close to a correlation of 1 may be explained by a group of probesets having almost constantly high signal. Most of these are 'hub' probesets as defined in the text. The green distribution is a normal distribution with the same mean ( = 0.018) and standard deviation as the black one. It can be seen that the global distribution is very close to normal.
Figure 4
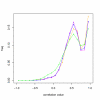
Effect of MT in real data on correlation between probesets. Distribution of Pearson correlation for MT-associated probesets. Curves correspond to the number of interacting probes in the PTP motif: orange – 1 probe, magenta – up to 3 probes, blue – up to 7 probes, green – all MT probeset pairs. The peak at the correlation close to 1 is due to hub probesets that generally have high intensity and match to many transcripts with single probes.
Figure 5
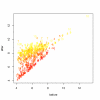
Simulation experiment – fold change. Change in measured signal intensity following spiking to simulate the presence of an additional hybridizing transcript in equal abundance to the intended target. Numbers denote the quantity of probes modified in a probeset. Axes are _log_2. Even a single spiked probe can result in significant change of the intensity. Fold changes can be seen even for high intensity target probesets.
Figure 6
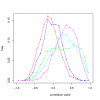
Variance filtering of spikes and target probesets. The distribution of correlation for data generated as in Figure 5, but grouped according to variance. Green – high variance probeset plus high variance spiking, blue – high variance probeset plus low variance spiking, magenta – low variance probeset plus low variance spiking, cyan – low variance probeset plus high variance spiking. Red – correlation before spiking. The effects of multiple targeting on correlation is most pronounced when the intended target is of low variance, however even in the case of high variance targets, correlation is likely to be influenced.
Figure 7
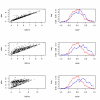
Influence of the level of spiking on RMA expression values and distributions of correlation. 1st row: f f = 0.05, 2nd row: f f = 0.2, 3rd row: f f = 1. 1st column scatterplot of the signal after RMA versus the signal before spiking, 2nd column distortion of the correlation distribution – changes after spiking. 500 randomly selected targets and spikes. Even small amount of stray signal may significantly influence correlation. For f f = 0.2, the fold change is not so much affected, but the effect on correlation distortion is almost as large as for f f = 1.
Figure 8
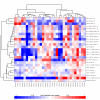
Heatmap example. Heatmap and hierarchical clustering of 3 families of probesets (MT-driven, tubulin and a functional one), plus randomly chosen non-MT probesets. The clustering does not make any distinction between functional and MT families – is grouping them together in very similar way.
Similar articles
- Transcript-level annotation of Affymetrix probesets improves the interpretation of gene expression data.
Yu H, Wang F, Tu K, Xie L, Li YY, Li YX. Yu H, et al. BMC Bioinformatics. 2007 Jun 11;8:194. doi: 10.1186/1471-2105-8-194. BMC Bioinformatics. 2007. PMID: 17559689 Free PMC article. - Characterization of mismatch and high-signal intensity probes associated with Affymetrix genechips.
Wang Y, Miao ZH, Pommier Y, Kawasaki ES, Player A. Wang Y, et al. Bioinformatics. 2007 Aug 15;23(16):2088-95. doi: 10.1093/bioinformatics/btm306. Epub 2007 Jun 6. Bioinformatics. 2007. PMID: 17553856 - Comparisons of annotation predictions for affymetrix GeneChips.
Stalteri M, Harrison A. Stalteri M, et al. Appl Bioinformatics. 2006;5(4):237-48. doi: 10.2165/00822942-200605040-00006. Appl Bioinformatics. 2006. PMID: 17140270 - Conjugated polyelectrolytes for label-free DNA microarrays.
He F, Feng F, Wang S. He F, et al. Trends Biotechnol. 2008 Feb;26(2):57-9. doi: 10.1016/j.tibtech.2007.10.010. Epub 2008 Jan 11. Trends Biotechnol. 2008. PMID: 18191257 Review. - Expression Profiling Using Affymetrix GeneChip Microarrays.
Auer H, Newsom DL, Kornacker K. Auer H, et al. Methods Mol Biol. 2009;509:35-46. doi: 10.1007/978-1-59745-372-1_3. Methods Mol Biol. 2009. PMID: 19212713 Review.
Cited by
- Multi-parameter systematic strategies for predictive, preventive and personalised medicine in cancer.
Hu R, Wang X, Zhan X. Hu R, et al. EPMA J. 2013 Jan 22;4(1):2. doi: 10.1186/1878-5085-4-2. EPMA J. 2013. PMID: 23339750 Free PMC article. - Identifying novel transcriptional components controlling energy metabolism.
Gupta RK, Rosen ED, Spiegelman BM. Gupta RK, et al. Cell Metab. 2011 Dec 7;14(6):739-45. doi: 10.1016/j.cmet.2011.11.007. Cell Metab. 2011. PMID: 22152302 Free PMC article. Review. - Deep RNA sequencing reveals novel cardiac transcriptomic signatures for physiological and pathological hypertrophy.
Song HK, Hong SE, Kim T, Kim DH. Song HK, et al. PLoS One. 2012;7(4):e35552. doi: 10.1371/journal.pone.0035552. Epub 2012 Apr 16. PLoS One. 2012. PMID: 22523601 Free PMC article. - Modeling non-uniformity in short-read rates in RNA-Seq data.
Li J, Jiang H, Wong WH. Li J, et al. Genome Biol. 2010;11(5):R50. doi: 10.1186/gb-2010-11-5-r50. Epub 2010 May 11. Genome Biol. 2010. PMID: 20459815 Free PMC article. - Impact of noise on molecular network inference.
Nagarajan R, Scutari M. Nagarajan R, et al. PLoS One. 2013 Dec 5;8(12):e80735. doi: 10.1371/journal.pone.0080735. eCollection 2013. PLoS One. 2013. PMID: 24339879 Free PMC article.
References
Publication types
MeSH terms
Substances
LinkOut - more resources
Full Text Sources
Other Literature Sources


