CTLA4 blockade and GM-CSF combination immunotherapy alters the intratumor balance of effector and regulatory T cells - PubMed (original) (raw)
. 2006 Jul;116(7):1935-45.
doi: 10.1172/JCI27745. Epub 2006 Jun 15.
Affiliations
- PMID: 16778987
- PMCID: PMC1479425
- DOI: 10.1172/JCI27745
CTLA4 blockade and GM-CSF combination immunotherapy alters the intratumor balance of effector and regulatory T cells
Sergio A Quezada et al. J Clin Invest. 2006 Jul.
Abstract
CTL-associated antigen 4 (CTLA4) blockade releases inhibitory controls on T cell activation and proliferation, inducing antitumor immunity in both preclinical and early clinical trials. We examined the mechanisms of action of anti-CTLA4 and a GM-CSF-transduced tumor cell vaccine (Gvax) and their impact on the balance of effector T cells (Teffs) and Tregs in an in vivo model of B16/BL6 melanoma. Tumor challenge increased the frequency of Tregs in lymph nodes, and untreated tumors became infiltrated by CD4+Foxp3- and CD4+Foxp3+ T cells but few CD8+ T cells. Anti-CTLA4 did not deplete Tregs or permanently impair their function but acted in a cell-intrinsic manner on both Tregs and Teffs, allowing them to expand, most likely in response to self antigen. While Gvax primed the tumor-reactive Teff compartment, inducing activation, tumor infiltration, and a delay in tumor growth, the combination with CTLA4 blockade induced greater infiltration and a striking change in the intratumor balance of Tregs and Teffs that directly correlated with tumor rejection. The data suggest that Tregs control both CD4+ and CD8+ T cell activity within the tumor, highlight the importance of the intratumor ratio of effectors to regulators, and demonstrate inversion of the ratio and correlation with tumor rejection during Gvax/anti-CTLA4 immunotherapy.
Figures
Figure 1. CTLA4 blockade enhances Teff proliferation in vitro.
CD4+CD25+ Tregs and CD4+CD25– Teffs were isolated from lymph nodes and stimulated in vitro with irradiated T cell–depleted splenocytes in the presence of 10 μg/ml anti-CD3 in the presence or absence of 50 μg/ml anti-CTLA4 monoclonal antibody. [3H]thymidine was added for the last 8 hours of a 72-hour culture. The data are representative of 3 independent experiments.
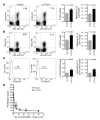
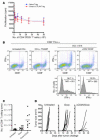
Figure 2. Chronic CTLA4 blockade increases the frequency of Tregs in the lymph nodes without permanently altering their regulatory activity.
Mice were treated for a 2-week period with 100 μg anti-CTLA4 or control mouse Ig every other day. Lymph nodes were harvested and stained for CD4, CD25, and Foxp3. Data are presented as cytometric dot plots and graphically as percentages and absolute numbers of CD4+CD25+ (A), CD4+Foxp3+ (B), and CD4+Foxp3+ cells gated on the CD25– population (C). (D) CD4+CD25+ Tregs were isolated from mice treated/untreated with anti-CTLA4 for 2 weeks and tested for their ability to suppress naive CD4+CD25– T cell expansion in vitro in response to irradiated T cell–depleted splenocytes and 10 μg/ml anti-CD3. [3H]thymidine was added for the last 8 hours of a 72-hour culture. The numbers in the upper-right corners of the dot plots represent the percentage of cells in that quadrant, and the data are representative of 3 independent experiments with 3 independently analyzed mice/group.
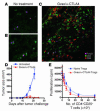
Figure 3. Gvax/anti-CTLA4 combination therapy induces tumor infiltration and rejection without permanently impairing Treg function.
Immunofluorescence microscopy of 8-μm-thick sections from 15-day-old tumors from untreated mice (A and B) and mice treated with Gvax/anti-CTLA4 (C). Tumor sections were fixed in acetone and stained with anti-CD4–FITC (green), anti-CD8–PE (red), and anti-Foxp3+ APC (pink). Samples were analyzed with a Leica Microsystems inverted confocal microscope with a ×20 water immersion objective. The data are representative of 3 independent experiments with 3 mice/group. (D) In parallel experiments, mice (n = 10 mice per group) were monitored for tumor growth and rejection upon treatment with Gvax/anti-CTLA4 combination therapy. (E) CD4+CD25+ Tregs from tumor-draining lymph nodes of Gvax/anti-CTLA4–treated mice or naive mice were tested for their ability to suppress CD4+CD25– T cell proliferation in vitro.
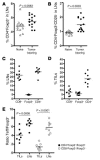
Figure 4. B16 melanoma TILs contain a high frequency of CD4+ and Foxp3+ but few CD8+ T cells.
The percentage of CD4+Foxp3+ T cells (A) and CD4+Foxp3+CD25– T cells (B) was analyzed by flow cytometry of lymph nodes from naive and tumor-bearing mice 15 days after tumor challenge. In a parallel set of studies, lymph nodes (C) and tumors (D) from tumor-bearing mice were analyzed at day 15 for their content of CD8+, Foxp3+, and CD4+ T cells. (E) The ratio of CD4+Foxp3– to Foxp3+ T cells (filled circles) and CD8+Foxp3– to Foxp3+ T cells (open circles) was calculated and compared in tumors and lymph nodes from tumor-bearing mice 15 days after tumor challenge. The data represent cumulative results from 3 independent experiments with 3–5 mice/group.
Figure 5. Gvax/anti-CTLA4 treatment increases the ratio of effector CD4+ T cells to Tregs in the tumor but not in the lymph nodes.
Fifteen days after tumor challenge, lymph nodes (A and B) and tumors (C and D) from untreated or Gvax/anti-CTLA4–treated mice were analyzed by flow cytometry for their content of CD4+ and Foxp3+ T cells. A and C show representative dot plots for untreated and treated mice, while B and D show the ratio of CD4+Foxp3– to CD4+Foxp3+ cells in 1 of 3 representative experiments with 3 independently analyzed mice/group.
Figure 6. Gvax/αCTLA4 treatment increase the ratio of effector CD8+ T cells to Tregs in the tumor but not in the lymph nodes.
Fifteen days after tumor challenge, lymph nodes (A and B) and tumors (C and D) from untreated or Gvax/anti-CTLA4–treated mice where analyzed by flow cytometry for their content of CD8+ and Foxp3+ T cells. A and C show representative dot plots for untreated and treated mice, while B and D show the ratio of CD8+ to Foxp3+ cells in 1 of 3 representative experiments with 3 independently analyzed mice/group.
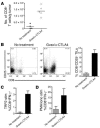
Figure 7. Gvax/anti-CTLA4 treatment increases the frequency and number of functional CD8+ T cells in tumors.
C57BL/6 mice were challenged with B16/BL6 tumor at day 0 and treated/not treated with Gvax/anti-CTLA4 at days 3, 6, and 9. (A) Fifteen days after tumor challenge, tumors were removed, weighed, and analyzed by flow cytometry for the number of infiltrating CD8+ T cells. The remaining cells were analyzed for the expression of CD25 (B) or restimulated in vitro with either TRP2 peptide (C, TRP2 stim) or PMA/ionomycin (D, PMA/iono stim) and analyzed for intracellular expression of IFN-γ as specified in Methods. The data are representative of 3 independent experiments with 3–5 independently analyzed mice/group.
Figure 8. CD4+ CD25+ Tregs suppress nonspecific and tumor-specific CD8+ T cell responses.
(A) CD4+CD25+ Tregs were isolated from Gvax/anti-CTLA4–treated or naive C57BL/6 mice and tested for their ability to suppress proliferation of CD8+ T cells isolated from naive mice. (B) CD8+ TILs were isolated from B16/BL6 tumors and restimulated overnight with DCs, DCs with irradiated TRAMP tumor, or DCs with irradiated B16/BL6 tumors in the presence or absence of naive CD4+CD25+ Tregs. Monensin was added for the last 4 hours of culture, and production of IFN-γ was determined by flow cytometry. In an additional set of experiments C57BL/6 mice were challenged with B16/BL6 and left untreated or treated with Gvax at days 3, 6, and 9 or anti-CD25 at day –4 and Gvax at days 3, 6, and 9. (C) Mice were sacrificed 15 days after tumor challenge, and tumors were removed, weighed, and analyzed by flow cytometry to determine the number of infiltrating CD8+ T cells. P = 0.0029, Gvax vs. Gvax/anti-CD25. (D) In parallel experiments, tumor growth and rejection were followed over time in the different groups. The numbers of mice/group rejecting tumors were: untreated, 0/5; Gvax, 2/10 (P = 0.5238); Gvax/anti-CD25, 7/10 (P = 0.0256). Data are representative of 2 independent experiments.
Similar articles
- Tumor vaccines expressing flt3 ligand synergize with ctla-4 blockade to reject preimplanted tumors.
Curran MA, Allison JP. Curran MA, et al. Cancer Res. 2009 Oct 1;69(19):7747-55. doi: 10.1158/0008-5472.CAN-08-3289. Epub 2009 Sep 8. Cancer Res. 2009. PMID: 19738077 Free PMC article. - Elucidating the autoimmune and antitumor effector mechanisms of a treatment based on cytotoxic T lymphocyte antigen-4 blockade in combination with a B16 melanoma vaccine: comparison of prophylaxis and therapy.
van Elsas A, Sutmuller RP, Hurwitz AA, Ziskin J, Villasenor J, Medema JP, Overwijk WW, Restifo NP, Melief CJ, Offringa R, Allison JP. van Elsas A, et al. J Exp Med. 2001 Aug 20;194(4):481-9. doi: 10.1084/jem.194.4.481. J Exp Med. 2001. PMID: 11514604 Free PMC article. - Contrasting effects of TNF and anti-TNF on the activation of effector T cells and regulatory T cells in autoimmunity.
Chen X, Oppenheim JJ. Chen X, et al. FEBS Lett. 2011 Dec 1;585(23):3611-8. doi: 10.1016/j.febslet.2011.04.025. Epub 2011 Apr 15. FEBS Lett. 2011. PMID: 21513711 Free PMC article. Review. - Altering regulatory T cell function in cancer immunotherapy: a novel means to boost the efficacy of cancer vaccines.
Ruter J, Barnett BG, Kryczek I, Brumlik MJ, Daniel BJ, Coukos G, Zou W, Curiel TJ. Ruter J, et al. Front Biosci (Landmark Ed). 2009 Jan 1;14(5):1761-70. doi: 10.2741/3338. Front Biosci (Landmark Ed). 2009. PMID: 19273160 Review.
Cited by
- Selecting antigens for cancer vaccines.
Avogadri F, Wolchok JD. Avogadri F, et al. Nat Biotechnol. 2012 Apr 10;30(4):328-9. doi: 10.1038/nbt.2174. Nat Biotechnol. 2012. PMID: 22491282 No abstract available. - Immune checkpoint targeting in cancer therapy: toward combination strategies with curative potential.
Sharma P, Allison JP. Sharma P, et al. Cell. 2015 Apr 9;161(2):205-14. doi: 10.1016/j.cell.2015.03.030. Cell. 2015. PMID: 25860605 Free PMC article. Review. - Tumour heterogeneity and immune-modulation.
Jamal-Hanjani M, Thanopoulou E, Peggs KS, Quezada SA, Swanton C. Jamal-Hanjani M, et al. Curr Opin Pharmacol. 2013 Aug;13(4):497-503. doi: 10.1016/j.coph.2013.04.006. Epub 2013 May 7. Curr Opin Pharmacol. 2013. PMID: 23664091 Free PMC article. Review. - DNA vaccines, electroporation and their applications in cancer treatment.
Lee SH, Danishmalik SN, Sin JI. Lee SH, et al. Hum Vaccin Immunother. 2015;11(8):1889-900. doi: 10.1080/21645515.2015.1035502. Hum Vaccin Immunother. 2015. PMID: 25984993 Free PMC article. Review. - Melanoma vaccines and modulation of the immune system in the clinical setting: building from new realities.
Madorsky-Rowdo FP, Lacreu ML, Mordoh J. Madorsky-Rowdo FP, et al. Front Immunol. 2012 May 4;3:103. doi: 10.3389/fimmu.2012.00103. eCollection 2012. Front Immunol. 2012. PMID: 22566975 Free PMC article.
References
- Greenwald R.J., Freeman G.J., Sharpe A.H. The B7 family revisited. Annu. Rev. Immunol. 2005;23:515–548. - PubMed
- Brunner M.C., et al. CTLA-4-mediated inhibition of early events of T cell proliferation. . J. Immunol. 1999;162:5813–5820. - PubMed
- Greenwald R.J., Boussiotis V.A., Lorsbach R.B., Abbas A.K., Sharpe A.H. CTLA-4 regulates induction of anergy in vivo. Immunity. 2001;14:145–155. - PubMed
- Egen J.G., Allison J.P. Cytotoxic T lymphocyte antigen-4 accumulation in the immunological synapse is regulated by TCR signal strength. Immunity. 2002;16:23–35. - PubMed
Publication types
MeSH terms
Substances
LinkOut - more resources
Full Text Sources
Other Literature Sources
Research Materials

