Identification and validation of oncogenes in liver cancer using an integrative oncogenomic approach - PubMed (original) (raw)
Comparative Study
. 2006 Jun 30;125(7):1253-67.
doi: 10.1016/j.cell.2006.05.030.
Mona S Spector, Wen Xue, Peer Flemming, Carlos Cordon-Cardo, John Silke, Sheung-Tat Fan, John M Luk, Michael Wigler, Gregory J Hannon, David Mu, Robert Lucito, Scott Powers, Scott W Lowe
Affiliations
- PMID: 16814713
- PMCID: PMC3026384
- DOI: 10.1016/j.cell.2006.05.030
Comparative Study
Identification and validation of oncogenes in liver cancer using an integrative oncogenomic approach
Lars Zender et al. Cell. 2006.
Abstract
The heterogeneity and instability of human tumors hamper straightforward identification of cancer-causing mutations through genomic approaches alone. Herein we describe a mouse model of liver cancer initiated from progenitor cells harboring defined cancer-predisposing lesions. Genome-wide analyses of tumors in this mouse model and in human hepatocellular carcinomas revealed a recurrent amplification at mouse chromosome 9qA1, the syntenic region of human chromosome 11q22. Gene-expression analyses delineated cIAP1, a known inhibitor of apoptosis, and Yap, a transcription factor, as candidate oncogenes in the amplicon. In the genetic context of their amplification, both cIAP1 and Yap accelerated tumorigenesis and were required to sustain rapid growth of amplicon-containing tumors. Furthermore, cIAP1 and Yap cooperated to promote tumorigenesis. Our results establish a tractable model of liver cancer, identify two oncogenes that cooperate by virtue of their coamplification in the same genomic locus, and suggest an efficient strategy for the annotation of human cancer genes.
Figures
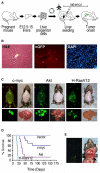
Figure 1. Development and Characterization of a Genetically Tractable, Transplantable Mouse Model of HCC
(A) Schematic diagram showing the generation of in situ liver carcinomas following retroviral transduction of purified E-cadherin+ hepato-blasts (see Figure S1). (B) Analysis of liver sections from mice seeded with GFP-expressing hepatoblasts 1 week postreconstitution. Left, H&E; middle, anti-GFP immunofluorescence; right, DAPI. (C) External GFP tumor imaging (top panels) or direct imaging of the respective explanted tumor-bearing livers (bottom panels) of mice reconstituted with _p53_−/− hepatoblasts transduced with the indicated oncogene. (D) Survival curves of mice after intrahepatic seeding of _p53_−/− liver progenitor cells transduced with the indicated oncogene or control vector. (E) Explanted murine liver carcinomas (_p53_−/−; myc) were grown briefly in culture and then directly injected into the left liver lobe. Shown is a GFP-expressing (left) in situ tumor (right) 42 days postinjection.
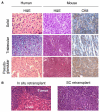
Figure 2. Murine Liver Carcinomas Derived from E-Cadherin+ Liver Progenitor Cells Histopathologically Resemble Human HCC
(A) H&E-stained sections of human HCC with the indicated histopathological variegation (left panels) shown adjacent to corresponding histopathologies in murine liver cancers arising from _p53_−/−;myc hepatoblasts (center panels). Anti-CK8 immunohistochemistry of the murine tumors is shown at right. (B) H&E staining of in situ and subcutaneously retransplanted HCCs derived from _p53_−/− ;myc hepatoblasts.
Figure 3. ROMA Identifies Focal DNA Amplifications in Murine HCCs
(A) ROMA profile of a tumor derived from _p53_−/−;Ras embryonic hepatoblasts. Data plotted are the normalized log ratio for each probe (*EST). (B) Single-probe resolution of chromosome 15 corresponding to the tumor described in (A). (C) Genome-wide profiles of three independent HCCs (Tu-7, Tu-9, and Tu-13) derived from _p53_−/−;myc embryonic hepatoblasts. (D) Single-probe resolution of chromosome 9qA1 from the tumors described in (C). The minimal overlap region contains the indicated genes.
Figure 4. ROMA Identifies Amplification of the Human Syntenic Region 11q22 in HCC and Ovarian Cancer
(A) Genome-wide profile of a human HCC harboring an amplification on chromosome 7 containing the c-met gene and three regions amplified on chromosome 11. (B) Single-probe resolution of chromosome 11, with genes contained within each amplicon depicted below. (C) Genome-wide profile of an ovarian carcinoma containing the 11q22 amplification. (D) Single-probe resolution of the 11q22 amplicon, with genes contained within the amplified region depicted below.
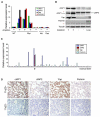
Figure 5. cIAP1 and Yap Are Consistently Overexpressed in Mouse and Human Tumors Containing the 9qA1 or 11q22 Amplicon
(A) cIAP1, cIAP2, Yap, and Porimin mRNA levels in murine HCCs that contain the 9qA1 amplicon as determined by quantitative real-time RT-PCR analysis. (B) Protein lysates from 9qA1-positive (+) or -negative (−) liver cancers and adult mouse liver were immunoblotted with antibodies against cIAP1, cIAP1/2, Yap, and Porimin. * denotes nonspecific bands. Tubulin was used as a loading control. (C) Quantitative real-time RT-PCR analysis of cIAP1, cIAP2, Yap, and Porimin expression in human HCCs. * denotes a tumor with the 11q22 amplification. Cutoff for increased expression was >2-fold of the expression level in nonneoplastic liver (normal liver). (D) Immunohistochemistry of an 11q22-positive (top) and -negative (bottom) human HCC using antibodies against the indicated protein.
Figure 6. cIAP1 Enhances the Tumorigenicity of _myc_-Overexpressing _p53_−/− Hepatoblasts
(A) Apoptosis measurements (Cell Death Detection ELISAPLUS kit; Roche) from _p53_−/− hepatoblasts double infected with myc + cIAP1 or myc + vector following culture under the indicated serum conditions for 48 hr (left panel). Cells grown to confluence were cultured for another 48 hr, and cell death was measured (right panel). Error bars represent mean ± SD (n = 3) per data point. (B) Tumor volume measurements at various times following subcutaneous injection of _p53_−/− hepatoblasts double infected with myc + cIAP1 or myc + vector into the rear flanks of nude mice (n = 6 for each group). Shown is a representative of three independent experiments, each showing a statistical difference between cIAP1 and control (p < 0.05). Error bars represent ±SD. (C) Immunoblotting of tumors overexpressing _myc_-tagged cIAP1 (lanes 8–13) or control vector tumors (lanes 5–7) using antibodies against cIAP1. Samples from cultured _myc_-tagged _cIAP1_-expressing hepatoblasts (M, lane 2) or vector alone (V, lane 1) and from 9qA1 amplicon-containing cells (A+, lane 4) were analyzed for comparison. Note that myc_-tagged cIAP1 migrates at 75 kDa and endogenous cIAP1 at 65 kDa. A– is lysate from amplicon-negative cells of the same genotype (p53_−/−;myc). Tubulin was used as a loading control. (D and E) p53_−/− hepatoblasts coexpressing Ras (D) or Akt (E) with cIAP1 or a control vector were monitored for tumorigenicity following subcutaneous injection into nude mice (n = 6 per group). Error bars represent ±SD. (F) Immunoblotting of lysates derived from hepatoma cells outgrown from a 9qA1-positive p53_−/−;myc tumor transduced with shRNAs targeting cIAP1 and cIAP2 (sh 1+2) or control vectors (V) using antibodies against cIAP1. (G and H) 9qA1-positive (G) and -negative (H) hepatoma cells expressing cIAP1/2 shRNAs or a control vector were monitored for tumor growth following subcutaneous injection into nude mice. Error bars represent ±SD.
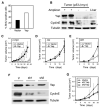
Figure 7. Yap Confers a Proliferative Advantage, Has Oncogenic Properties, and Is Required for Liver Tumor Progression
(A) The proliferation rates of p53_−/−;myc_ hepatoblasts expressing Yap or a control vector were assessed by the fraction of nuclei incorporating BrdU after a 1 hr pulse. (B) Protein lysates from two 9qA1 amplicon-positive tumors (+), two amplicon-negative tumors (−), and adult normal mouse liver were immunoblotted with antibodies against Yap and cyclin E. Tubulin was used as a loading control. * denotes a nonspecific band in the liver lysate. (C–E) The tumorigenicity of p53_−/− liver progenitor cells coexpressing the indicated oncogene (upper left) with a control vector or Yap was assessed by caliper measurement following subcutaneous injection into the rear flanks of nude mice (n = 4 per group). Error bars represent ±SD. (F) Protein lysates from hepatoma cells (p53_−/−;myc) stably overexpressing Yap were infected with control vector (V) or two different short-hairpin RNAs targeting Yap (sh1 and sh2) and were analyzed for Yap and cyclin E levels. Tubulin was used as a loading control. (G) Tumorigenicity of 9qA1-positive cells infected with retroviral vectors expressing shRNAs targeting Yap (sh1Yap or sh2Yap) or control vector (n = 6 per group). Error bars represent ±SD.
Figure 8. cIAP1 and Yap Synergize to Drive Tumorigenesis
(A) p53−/−;myc liver progenitor cells were infected with control vector, cIAP1, or Yap or coinfected with Yap + cIAP1 and then transplanted subcutaneously into nude mice (n = 6 per group). Error bars represent ±SD. (B) GFP imaging of the tumors described in (A).
Comment in
- Cross-species oncogenomics in cancer gene identification.
Peeper D, Berns A. Peeper D, et al. Cell. 2006 Jun 30;125(7):1230-3. doi: 10.1016/j.cell.2006.06.018. Cell. 2006. PMID: 16814709
Similar articles
- Cross-species oncogenomics in cancer gene identification.
Peeper D, Berns A. Peeper D, et al. Cell. 2006 Jun 30;125(7):1230-3. doi: 10.1016/j.cell.2006.06.018. Cell. 2006. PMID: 16814709 - Of mice and men: cancer gene discovery using comparative oncogenomics.
Tomlins SA, Chinnaiyan AM. Tomlins SA, et al. Cancer Cell. 2006 Jul;10(1):2-4. doi: 10.1016/j.ccr.2006.06.013. Cancer Cell. 2006. PMID: 16843259 - Rb inactivation accelerates neoplastic growth and substitutes for recurrent amplification of cIAP1, cIAP2 and Yap1 in sporadic mammary carcinoma associated with p53 deficiency.
Cheng L, Zhou Z, Flesken-Nikitin A, Toshkov IA, Wang W, Camps J, Ried T, Nikitin AY. Cheng L, et al. Oncogene. 2010 Oct 21;29(42):5700-11. doi: 10.1038/onc.2010.300. Epub 2010 Aug 2. Oncogene. 2010. PMID: 20676140 Free PMC article. - [Nonautonomous effects of oncogenic YAP in hepatocarcinogenesis].
Marquard S, Thomann S, Weiler SME, Sticht C, Gretz N, Schirmacher P, Breuhahn K. Marquard S, et al. Pathologe. 2017 Nov;38(Suppl 2):175-179. doi: 10.1007/s00292-017-0361-2. Pathologe. 2017. PMID: 29018944 Review. German. - Overview of the molecular biology of hepatocellular neoplasms and hepatoblastomas of the mouse liver.
Kim Y, Sills RC, Houle CD. Kim Y, et al. Toxicol Pathol. 2005;33(1):175-80. doi: 10.1080/01926230590522130. Toxicol Pathol. 2005. PMID: 15805069 Review.
Cited by
- Advancements of anticancer agents by targeting the Hippo signalling pathway: biological activity, selectivity, docking analysis, and structure-activity relationship.
Haripriya E, Hemalatha K, Matada GSP, Pal R, Das PK, Ashadul Sk MD, Mounika S, Viji MP, Aayishamma I, Jayashree KR. Haripriya E, et al. Mol Divers. 2024 Oct 22. doi: 10.1007/s11030-024-11009-1. Online ahead of print. Mol Divers. 2024. PMID: 39436581 Review. - Gene therapy for diffuse pleural mesotheliomas in preclinical models by concurrent expression of NF2 and SuperHippo.
Zhu R, Liu X, Zhang X, Zhong Z, Qi S, Jin R, Gu Y, Wang Y, Ling C, Chen K, Ye D, Yu FX. Zhu R, et al. Cell Rep Med. 2024 Oct 15;5(10):101763. doi: 10.1016/j.xcrm.2024.101763. Epub 2024 Oct 4. Cell Rep Med. 2024. PMID: 39368484 Free PMC article. - Menin in Cancer.
Majer AD, Hua X, Katona BW. Majer AD, et al. Genes (Basel). 2024 Sep 21;15(9):1231. doi: 10.3390/genes15091231. Genes (Basel). 2024. PMID: 39336822 Free PMC article. Review. - Going Rogue: Mechanisms, Regulation, and Roles of Mutationally Activated G_α_ in Human Cancer.
Dwyer MB, Aumiller JL, Wedegaertner PB. Dwyer MB, et al. Mol Pharmacol. 2024 Oct 17;106(5):198-215. doi: 10.1124/molpharm.124.000743. Mol Pharmacol. 2024. PMID: 39187387 Review. - Interaction of noncoding RNAs with hippo signaling pathway in cancer cells and cancer stem cells.
Abedimanesh S, Safaralizadeh R, Jahanafrooz Z, Najafi S, Amini M, Nazarloo SS, Bahojb Mahdavi SZ, Baradaran B, Jebelli A, Mokhtarzadeh AA. Abedimanesh S, et al. Noncoding RNA Res. 2024 Jun 6;9(4):1292-1307. doi: 10.1016/j.ncrna.2024.06.006. eCollection 2024 Dec. Noncoding RNA Res. 2024. PMID: 39045083 Free PMC article. Review.
References
- Aguilar F, Harris CC, Sun T, Hollstein M, Cerutti P. Geographic variation of p53 mutational profile in nonmalignant human liver. Science. 1994;264:1317–1319. - PubMed
- Artandi SE, Depinho RA. Mice without telomerase: what can they teach us about human cancer? Nat. Med. 2000;6:852–855. - PubMed
- Basu S, Totty NF, Irwin MS, Sudol M, Downward J. Akt phosphorylates the Yes-associated protein, YAP, to induce interaction with 14–3-3 and attenuation of p73-mediated apoptosis. Mol. Cell. 2003;11:11–23. - PubMed
Publication types
MeSH terms
Substances
Grants and funding
- CA13106/CA/NCI NIH HHS/United States
- CA078544/CA/NCI NIH HHS/United States
- R01 CA078544/CA/NCI NIH HHS/United States
- P30 CA008748/CA/NCI NIH HHS/United States
- P01 CA087497/CA/NCI NIH HHS/United States
- U01 CA105388/CA/NCI NIH HHS/United States
- P01 CA013106/CA/NCI NIH HHS/United States
- CA105388/CA/NCI NIH HHS/United States
- CA87497/CA/NCI NIH HHS/United States
- HHMI/Howard Hughes Medical Institute/United States
LinkOut - more resources
Full Text Sources
Other Literature Sources
Medical


