Transforming properties of YAP, a candidate oncogene on the chromosome 11q22 amplicon - PubMed (original) (raw)
Transforming properties of YAP, a candidate oncogene on the chromosome 11q22 amplicon
Michael Overholtzer et al. Proc Natl Acad Sci U S A. 2006.
Abstract
In a screen for gene copy-number changes in mouse mammary tumors, we identified a tumor with a small 350-kb amplicon from a region that is syntenic to a much larger locus amplified in human cancers at chromosome 11q22. The mouse amplicon contains only one known gene, Yap, encoding the mammalian ortholog of Drosophila Yorkie (Yki), a downstream effector of the Hippo(Hpo)-Salvador(Sav)-Warts(Wts) signaling cascade, recently identified in flies as a critical regulator of cellular proliferation and apoptosis. In nontransformed mammary epithelial cells, overexpression of human YAP induces epithelial-to-mesenchymal transition, suppression of apoptosis, growth factor-independent proliferation, and anchorage-independent growth in soft agar. Together, these observations point to a potential oncogenic role for YAP in 11q22-amplified human cancers, and they suggest that this highly conserved signaling pathway identified in Drosophila regulates both cellular proliferation and apoptosis in mammalian epithelial cells.
Conflict of interest statement
Conflict of interest statement: No conflicts declared.
Figures
Fig. 1.
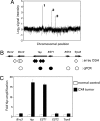
Yap is a candidate “driver” gene in the mouse chromosome 9 amplicon. (A) Whole-genome profile of an individual tumor (CX4) showing ratio of tumor DNA signal vs. normal DNA control from the same mouse; _x-_axis coordinates represent oligonucleotide probes ordered by genomic map position, with the whole-genome filtered median (three nearest neighbors) data set plotted. High-level amplifications are labeled 1–3 and correspond to: 1, 2.6-Mb amplicon on chromosome 6, centering on Met (2); 2, 350-kb amplicon on chromosome 9, centering on Yap; 3, 4.6-Mb amplicon on chromosome 10, containing a large number of genes. (B) Mouse chromosome 9 amplicon. Filled diamonds denote the positions of probes detecting genomic amplification in CX4. Open diamonds indicate the positions of closest-neighbor probes detecting normal DNA copy number. Circles represent data from C. Filled circles denote amplification, and open circles indicate normal DNA content. (C) Independent confirmation of the amplicon boundaries by using qPCR.
Fig. 2.
YAP induces an EMT. (A) YAP induces a morphology change on monolayer cultures. Representative phase-contrast images of MCF10A-YAP and vector control cells growing in monolayer cultures are shown. (Scale bars, 100 μm.) (B) YAP induces an invasive three-dimensional morphology. MCF10A-YAP and vector control cells were cultured on Matrigel for 8 days. Representative phase-contrast images are shown, increasing in magnification from left to right. (Scale bars, 100 μm.) (C) Expression of YAP results in loss of epithelial markers and gain of mesenchymal markers. Immunoblotting analysis reveals a decrease in E-cadherin and occludin (epithelial markers) and concomitant increase in N-cadherin, vimentin, and fibronectin (mesenchymal markers). β-Tubulin is used to show equal loading. (D) YAP overexpression results in loss of membrane E-cadherin and cortical actin. Immunofluorescence analysis shows loss of plasma membrane E-cadherin (magnification, ×50) and loss of localization of actin (stained with phalloidin; magnification, ×100) at cortical sites adjacent to cell–cell interfaces in MCF10A-YAP cells. (E) YAP induces Transwell migration. Control and _YAP_-expressing MCF10A cells were plated onto 8-μm Transwell filters and allowed to migrate for 24 h either in the presence (+EGF) or in the absence (−EGF) of EGF. Data are the mean number of migrated cells per ×20 field of four fields. Error bars equal ±SD of three independent experiments.
Fig. 3.
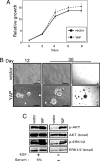
YAP overexpression promotes proliferation. (A) YAP overexpression does not affect growth rate in the presence of EGF. MCF10A-vector cells were grown in parallel to MCF10A-YAP cells, and their growth was assessed over an 8-day time course. (B) YAP overexpression activates EGF-independent growth. MCF10A-YAP cells and vector control cells were grown on Matrigel in medium without EGF for 30 days. Representative phase-contrast images are shown from one of three independent experiments on day 12 on the Left, and both a high-power (Center) and low-power (Right) magnification of day 30. (Scale bars, 100 μm.) (C) YAP overexpression results in activation of ERK1/2 and AKT pathways. Immunoblotting analysis with antibodies to phosphorylated ERK1/2 (Thr-202/Tyr-204) and AKT (Ser-473) shows increased activation in MCF10A-YAP cells in the absence of EGF and serum.
Fig. 4.
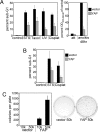
YAP overexpression inhibits apoptosis and transforms MCF10A cells. (A) YAP overexpression inhibits apoptosis in MCF10A cells. Control and MCF10A-YAP monolayer cells were treated with STS, Taxol, UV light, or cisplatin (Cisplat), or they were detached from matrix (anoikis) to induce apoptosis. (A Left) Data are the mean percentages of sub-G1 DNA content cells determined by flow-cytometric analysis of propidium iodide-stained samples collected after the indicated treatments. (A Right) Cell-death data were quantified by using the cell-death detection ELISA kit, which measures DNA fragmentation; the data are the mean absorbance readings at 405–490 nm relative to vector control cells after 48 h of anoikis. att, attached control monolayer cells. All error bars equal ±SD of three independent experiments. (B) YAP overexpression inhibits apoptosis in HMEC. HMECtert-vector cells and HMECtert-YAP cells were treated with STS and cisplatin to induce apoptosis. Data are the mean percentages of the sub-G1 content cells determined by flow cytometry as in A. Error bars equal ±SD of three independent experiments. (C) YAP overexpression induces anchorage-independent growth in soft agar. MCF10A-YAP cells and vector control cells were plated in soft-agar assays and allowed to grow for 21 days. (Left) Data are the mean number of colonies per six-well culture of either 10,000 cells (10k) or 50,000 cells (50k). Error bars equal ±SD of three independent experiments. (Right) Representative wells stained with 0.02% iodonitrotetrazolium chloride are shown.
Similar articles
- The Hippo signaling pathway coordinately regulates cell proliferation and apoptosis by inactivating Yorkie, the Drosophila Homolog of YAP.
Huang J, Wu S, Barrera J, Matthews K, Pan D. Huang J, et al. Cell. 2005 Aug 12;122(3):421-34. doi: 10.1016/j.cell.2005.06.007. Cell. 2005. PMID: 16096061 - Hippo signaling promotes JNK-dependent cell migration.
Ma X, Wang H, Ji J, Xu W, Sun Y, Li W, Zhang X, Chen J, Xue L. Ma X, et al. Proc Natl Acad Sci U S A. 2017 Feb 21;114(8):1934-1939. doi: 10.1073/pnas.1621359114. Epub 2017 Feb 7. Proc Natl Acad Sci U S A. 2017. PMID: 28174264 Free PMC article. - TEAD mediates YAP-dependent gene induction and growth control.
Zhao B, Ye X, Yu J, Li L, Li W, Li S, Yu J, Lin JD, Wang CY, Chinnaiyan AM, Lai ZC, Guan KL. Zhao B, et al. Genes Dev. 2008 Jul 15;22(14):1962-71. doi: 10.1101/gad.1664408. Epub 2008 Jun 25. Genes Dev. 2008. PMID: 18579750 Free PMC article. - The dual functions of YAP-1 to promote and inhibit cell growth in human malignancy.
Wang H, Du YC, Zhou XJ, Liu H, Tang SC. Wang H, et al. Cancer Metastasis Rev. 2014 Mar;33(1):173-81. doi: 10.1007/s10555-013-9463-3. Cancer Metastasis Rev. 2014. PMID: 24346160 Review. - The Hippo pathway and apico-basal cell polarity.
Genevet A, Tapon N. Genevet A, et al. Biochem J. 2011 Jun 1;436(2):213-24. doi: 10.1042/BJ20110217. Biochem J. 2011. PMID: 21568941 Review.
Cited by
- Exploring STK3 in melanoma: a systematic review of signaling networks and therapeutic opportunities.
Khanahmadi M, Ebrahimi Fard M, Baghani M, Shayan M, Baghani M. Khanahmadi M, et al. Mol Biol Rep. 2024 Nov 22;52(1):8. doi: 10.1007/s11033-024-10064-z. Mol Biol Rep. 2024. PMID: 39576434 Review. - YAP acts as an independent prognostic marker and regulates growth and metastasis of gastrointestinal stromal tumors via FBXW7-YAP pathway.
Wu X, Yamashita K, Matsumoto C, Zhang W, Ding M, Harada K, Kosumi K, Eto K, Ida S, Miyamoto Y, Iwatsuki M. Wu X, et al. J Gastroenterol. 2024 Nov 18. doi: 10.1007/s00535-024-02180-1. Online ahead of print. J Gastroenterol. 2024. PMID: 39557657 - Advancements of anticancer agents by targeting the Hippo signalling pathway: biological activity, selectivity, docking analysis, and structure-activity relationship.
Haripriya E, Hemalatha K, Matada GSP, Pal R, Das PK, Ashadul Sk MD, Mounika S, Viji MP, Aayishamma I, Jayashree KR. Haripriya E, et al. Mol Divers. 2024 Oct 22. doi: 10.1007/s11030-024-11009-1. Online ahead of print. Mol Divers. 2024. PMID: 39436581 Review. - Transient proliferation by reversible YAP and mitogen-control of the cyclin D1/p27 ratio.
Ferrick KR, Fan Y, Ratnayeke N, Teruel MN, Meyer T. Ferrick KR, et al. bioRxiv [Preprint]. 2024 Nov 4:2024.10.11.617852. doi: 10.1101/2024.10.11.617852. bioRxiv. 2024. PMID: 39416132 Free PMC article. Preprint. - Skin Development and Disease: A Molecular Perspective.
Dermitzakis I, Chatzi D, Kyriakoudi SA, Evangelidis N, Vakirlis E, Meditskou S, Theotokis P, Manthou ME. Dermitzakis I, et al. Curr Issues Mol Biol. 2024 Jul 30;46(8):8239-8267. doi: 10.3390/cimb46080487. Curr Issues Mol Biol. 2024. PMID: 39194704 Free PMC article. Review.
References
- Pinkel D., Segraves R., Sudar D., Clark S., Poole I., Kowbel D., Collins C., Kuo W. L., Chen C., Zhai Y., et al. Nat. Genet. 1998;20:207–211. - PubMed
- Smolen G. A., Muir B., Mohapatra G., Barmettler A., Kim W. J., Rivera M. N., Haserlat S. M., Okimoto R. A., Kwak E., Dahiya S., et al. Cancer Res. 2006;66:3452–3455. - PubMed
- Baldwin C., Garnis C., Zhang L., Rosin M. P., Lam W. L. Cancer Res. 2005;65:7561–7567. - PubMed
- Dai Z., Zhu W. G., Morrison C. D., Brena R. M., Smiraglia D. J., Raval A., Wu Y. Z., Rush L. J., Ross P., Molina J. R., et al. Hum. Mol. Genet. 2003;12:791–801. - PubMed
Publication types
MeSH terms
Substances
Grants and funding
- P01 CA95281/CA/NCI NIH HHS/United States
- CA089393/CA/NCI NIH HHS/United States
- P01 CA080111/CA/NCI NIH HHS/United States
- P50 CA089393/CA/NCI NIH HHS/United States
- T32CA09361/CA/NCI NIH HHS/United States
- CA080111/CA/NCI NIH HHS/United States
- F32 CA117737/CA/NCI NIH HHS/United States
- T32 CA009361/CA/NCI NIH HHS/United States
LinkOut - more resources
Full Text Sources
Other Literature Sources
Research Materials


