Genomic convergence toward diploidy in Saccharomyces cerevisiae - PubMed (original) (raw)
Genomic convergence toward diploidy in Saccharomyces cerevisiae
Aleeza C Gerstein et al. PLoS Genet. 2006.
Abstract
Genome size, a fundamental aspect of any organism, is subject to a variety of mutational and selection pressures. We investigated genome size evolution in haploid, diploid, and tetraploid initially isogenic lines of the yeast Saccharomyces cerevisiae. Over the course of approximately 1,800 generations of mitotic division, we observed convergence toward diploid DNA content in all replicate lines. This convergence was observed in both unstressful and stressful environments, although the rate of convergence was dependent on initial ploidy and evolutionary environment. Comparative genomic hybridization with microarrays revealed nearly euploid DNA content by the end of the experiment. As the vegetative life cycle of S. cerevisiae is predominantly diploid, this experiment provides evidence that genome size evolution is constrained, with selection favouring the genomic content typical of the yeast's evolutionary past.
Conflict of interest statement
Competing interests. The authors have declared that no competing interests exist.
Figures
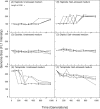
Figure 1. A Snapshot of Genome Size Change across 1,766 Generations of Batch Culture Evolution
Each data point is the mean of three FACScan measurements on a single colony sampled from a population. Apparent fluctuations are largely a result of genome size polymorphisms, leading to sampling fluctuations depending on which colony was randomly chosen (see Figure S1). The average standard error (shown in panel A) reflects measurement error. FL1 represents a linear scale of dye fluorescence as measured by flow cytometry. The five lines on each graph represent the five replicate lines evolved independently.
Figure 2. The Three Indels Identified by CGH Analysis of Ancestral (Generation 0) and Evolved (Generation 1,766) Tetraploid Lines
(i) An insertion of a ~13-kilobase fragment on Chromosome 4 in tetraploid salt line qs; (ii) a potential ~36-kilobase deletion of Chromosome 5 in tetraploid line R; (iii) a potential 20-kilobase deletion of Chromosome 12 in tetraploid salt line rs. (A) Results of CGH, where each dot represents the mean (bars: 95% CI) relative copy number of all genes in the indel from a single array. (B) Genes of known function (
2 October 2005) affected by the indel (basepair range of genes involved are given in brackets). Each box is one ORF, where red indicates transcription on the Watson strand, and blue for genes transcribed on the Crick strand.
Figure 3. Rate of Genomic Size Change by Ploidy and Environment
Rate of change was calculated by fitting linear regression lines through timeseries data (Figure 1) for each individually evolved line. Each data point thus represents the mean ± SE of five slope measures. This figure shows that haploids increased in genome size faster in salt, while tetraploids decreased in genome size more slowly in salt.
Similar articles
- The baker's yeast diploid genome is remarkably stable in vegetative growth and meiosis.
Nishant KT, Wei W, Mancera E, Argueso JL, Schlattl A, Delhomme N, Ma X, Bustamante CD, Korbel JO, Gu Z, Steinmetz LM, Alani E. Nishant KT, et al. PLoS Genet. 2010 Sep 9;6(9):e1001109. doi: 10.1371/journal.pgen.1001109. PLoS Genet. 2010. PMID: 20838597 Free PMC article. - Genome-wide genetic analysis of polyploidy in yeast.
Storchová Z, Breneman A, Cande J, Dunn J, Burbank K, O'Toole E, Pellman D. Storchová Z, et al. Nature. 2006 Oct 5;443(7111):541-7. doi: 10.1038/nature05178. Nature. 2006. PMID: 17024086 - High levels of chromosome instability in polyploids of Saccharomyces cerevisiae.
Mayer VW, Aguilera A. Mayer VW, et al. Mutat Res. 1990 Aug;231(2):177-86. doi: 10.1016/0027-5107(90)90024-x. Mutat Res. 1990. PMID: 2200955 - Whole-Genome Duplication and Yeast's Fruitful Way of Life.
Escalera-Fanjul X, Quezada H, Riego-Ruiz L, González A. Escalera-Fanjul X, et al. Trends Genet. 2019 Jan;35(1):42-54. doi: 10.1016/j.tig.2018.09.008. Epub 2018 Oct 23. Trends Genet. 2019. PMID: 30366621 Review. - DNA Repair in Haploid Context.
Mourrain L, Boissonneault G. Mourrain L, et al. Int J Mol Sci. 2021 Nov 17;22(22):12418. doi: 10.3390/ijms222212418. Int J Mol Sci. 2021. PMID: 34830299 Free PMC article. Review.
Cited by
- Polyploidy in fungi: evolution after whole-genome duplication.
Albertin W, Marullo P. Albertin W, et al. Proc Biol Sci. 2012 Jul 7;279(1738):2497-509. doi: 10.1098/rspb.2012.0434. Epub 2012 Apr 4. Proc Biol Sci. 2012. PMID: 22492065 Free PMC article. Review. - Gene duplication as a mechanism of genomic adaptation to a changing environment.
Kondrashov FA. Kondrashov FA. Proc Biol Sci. 2012 Dec 22;279(1749):5048-57. doi: 10.1098/rspb.2012.1108. Epub 2012 Sep 12. Proc Biol Sci. 2012. PMID: 22977152 Free PMC article. Review. - Genetic characterization and construction of an auxotrophic strain of Saccharomyces cerevisiae JP1, a Brazilian industrial yeast strain for bioethanol production.
Reis VC, Nicola AM, de Souza Oliveira Neto O, Batista VD, de Moraes LM, Torres FA. Reis VC, et al. J Ind Microbiol Biotechnol. 2012 Nov;39(11):1673-83. doi: 10.1007/s10295-012-1170-5. Epub 2012 Aug 15. J Ind Microbiol Biotechnol. 2012. PMID: 22892884 - Development of a Comprehensive Genotype-to-Fitness Map of Adaptation-Driving Mutations in Yeast.
Venkataram S, Dunn B, Li Y, Agarwala A, Chang J, Ebel ER, Geiler-Samerotte K, Hérissant L, Blundell JR, Levy SF, Fisher DS, Sherlock G, Petrov DA. Venkataram S, et al. Cell. 2016 Sep 8;166(6):1585-1596.e22. doi: 10.1016/j.cell.2016.08.002. Epub 2016 Sep 1. Cell. 2016. PMID: 27594428 Free PMC article. - Experimental Evolution Reveals Interplay between Sch9 and Polyploid Stability in Yeast.
Lu YJ, Swamy KB, Leu JY. Lu YJ, et al. PLoS Genet. 2016 Nov 3;12(11):e1006409. doi: 10.1371/journal.pgen.1006409. eCollection 2016 Nov. PLoS Genet. 2016. PMID: 27812096 Free PMC article.
References
- Cavalier-Smith T. Nuclear volume control by nucleoskeletal DNA, selection for cell volume and cell growth rate, and the solution of the DNA C-value paradox. J Cell Sci. 1978;34:247–278. - PubMed
- Gregory TR. Coincidence, coevolution, or correlation? DNA content, cell size, and the C-value enigma. Biol Rev. 2001;76:65–101. - PubMed
- Petrov DA. Evolution of genome size: New approaches to an old problem. Trends Genet. 2001;17:23–28. - PubMed
- Lewis WH. Polyploidy: Biological relevance. New York: Plenum Press; 1980. 583. p.
Publication types
MeSH terms
LinkOut - more resources
Full Text Sources
Other Literature Sources
Molecular Biology Databases
Research Materials
Miscellaneous


