Tissue-type plasminogen activator-mediated shedding of astrocytic low-density lipoprotein receptor-related protein increases the permeability of the neurovascular unit - PubMed (original) (raw)
Tissue-type plasminogen activator-mediated shedding of astrocytic low-density lipoprotein receptor-related protein increases the permeability of the neurovascular unit
Rohini Polavarapu et al. Blood. 2007.
Abstract
The low-density lipoprotein receptor-related protein (LRP) is a member of the LDL receptor gene family that binds several ligands, including tissue-type plasminogen activator (tPA). tPA is found in blood, where its primary function is as a thrombolytic enzyme, and in the central nervous system where it mediates events associated with cell death. Cerebral ischemia induces changes in the neurovascular unit (NVU) that result in brain edema. We investigated whether the interaction between tPA and LRP plays a role in the regulation of the permeability of the NVU during cerebral ischemia. We found that the ischemic insult induces shedding of LRP's ectodomain from perivascular astrocytes into the basement membrane. This event associates with the detachment of astrocytic end-feet processes and the formation of areas of perivascular edema. The shedding of LRP's ectodomain is significantly decreased in tPA deficient (tPA(-/-)) mice, is increased by incubation with tPA, and is inhibited by the receptor-associated protein (RAP). Furthermore, treatment with either RAP or anti-LRP IgG results in a faster recovery of motor activity and protection of the integrity of the NVU following middle cerebral artery occlusion (MCAO). Together, these results implicate tPA/LRP interactions as key regulators of the integrity of the NVU.
Figures
Figure 1
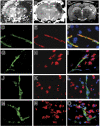
Immunohistochemical staining of LRP in the ischemic brain 3 hours after middle cerebral artery occlusion. Animals were subjected to MCAO followed by continuous MRI monitoring of cerebral blood flow (CBF), apparent diffusion coefficient (ADC) of water, and tissue changes associated with cerebral edema (T2-weighted images), followed by immunohistochemical analysis of LRP expression 180 minutes after the onset of the ischemic insult. (A-B) Changes in CBF (A) and ADC of water (B) 30 minutes after MCAO. Arrows in panel A depict the area of the brain with a greater than 80% decrease in CBF (dark zone). Arrows in panel B denote the area of irreversibly injured brain (dark area). (C) T2-weighted image of the same brain of panels A and B. Arrows depict the edge of the ischemic tissue with evolving cerebral edema (hyperintense signal). The black squares represent the areas of the brain were the immunohistochemical staining for LRP expression was performed. (D-I) Immunohistochemical staining with an antibody against CD31 (PECAM-1) (D,G) and the R2629 LRP antibody (E,H) in the area corresponding to the black squares in the ischemic (D-F) and nonischemic (G-I) hemispheres. Panels F and I correspond to merged images. (J-O) Immunohistochemical staining with an antibody against von Willebrand factor (J,M) and the 11H4 LRP antibody (K,N) in the area corresponding to the black squares depicted in panel C in the ischemic (J-L) and nonischemic (M-O) hemispheres. Panels L and O correspond to merged images. Images were visualized using a Leica DMRBE microscope (Leica, Houston, TX) equipped with a 100×/1.30 numerical aperture (NA) oil objective lens and a Leica DC 500 camera. Images were processed using software provided by the camera manufacturer.
Figure 2
Development of LRP-positive vascular structures in the murine brain 24 hours after middle cerebral artery occlusion. Wild-type mice were subjected to MCAO and killed 24 hours later. Tissue sections were prepared from the necrotic core (A-B), area of developing edema (C-D), and a corresponding area in the healthy, nonischemic contralateral hemisphere (E-F) and stained with either the R2629 (A,C,E) or the 11H4 antibody (B,D,F). Green is LRP staining and blue is DAPI. Arrows depict examples of LRP-positive vascular structures. (G) Number of LRP-positive vascular structures in the 3 areas of interest in the ischemic and nonischemic hemispheres 24 hours after the onset of cerebral ischemia. Error bars describe standard error of the mean; n = 6; *P < .05. Magnification, ×40 (A-F). Images were acquired as in Figure 1, except that a 40×/0.70 NA objective was used.
Figure 3
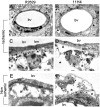
Effect of cerebral ischemia on LRP in the neurovascular unit. Electron microscopy analysis of LRP expression in the NVU in the ischemic (A-D) and corresponding nonischemic (E-F) hemispheres 6 hours after MCAO. Brains were stained with either the R2629 (A,C,E) or the 11H4 (B,D,F) antibodies. Arrows in panel A depict the presence of LRP-positive areas surrounding the blood vessel. Arrows in panel B point to LRP-positive perivascular astrocytes. Asterisks in panels A to D show areas where the perivascular astrocyte has detached from the basement membrane with development of early perivascular edema. Dashed arrows in panel D depict areas of astrocytic detachment of the glia limitants. Bv indicates blood vessel; bm, basement membrane; a, perivascular astrocyte; ec, endothelial cell. Magnification, ×5000 (A-B) and ×30 000 (C-F). Images were visualized using a Hitachi H-7500 electron microscope (Hitachi, Tokyo, Japan).
Figure 4
Effect of RAP or anti-LRP antibodies on the shedding of LRPs ectodomain, locomotor activity, and cerebral edema following MCAO. (A) Number of LRP-positive vascular structures in the 3 areas of interest in the ischemic hemisphere of wild-type animals 24 hours after MCAO and treatment with either PBS, the receptor-associated protein (RAP), or goat anti-LRP IgG. Error bars describe standard error of the mean; n = 6; *P < .05 relative to the PBS-treated group. (B) Mean locomotor activity at 6, 24, and 48 hours after MCAO and the intraventricular administration of either PBS (○), RAP (■), or goat anti-LRP IgG (▵). Error bars describe standard error of the mean; n = 6; *P < .05 when RAP- and LRP-treated animals are compared with PBS-treated mice. (C) Evans blue dye extravasation in the same group of animals of panel B, 48 hours after MCAO. Error bars describe standard error of the mean; n = 6; *P < .05 relative to PBS-injected brains. The pictures correspond to one representative brain in each experimental group. The blue staining is apparent in areas with increase in blood-brain barrier permeability (arrows).
Figure 5
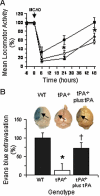
Effect of tPA on locomotor activity and cerebral edema following MCAO. (A) Mean locomotor activity at 6, 24, and 48 hours after MCAO in wild-type (○) or tPA−/− mice (■ and ▴); tPA−/− mice treated with murine tPA immediately after MCAO (▴). Error bars describe standard error of the mean; n = 6; *P < .05 when tPA−/− mice are compared with wild-type mice or with tPA−/− animals treated with tPA. (B) Evans blue dye extravasation in the same group of animals as panel A 48 hours after MCAO. Error bars describe standard error of the mean. *P < .01 when tPA−/− mice are compared with wild-type animals; †P < .05 when tPA−/− mice treated with recombinant tPA are compared with untreated tPA−/− mice. The pictures correspond to one representative brain in each experimental group. The blue staining is apparent in areas with increase in blood-brain barrier permeability (arrows).
Figure 6
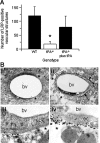
Effect of tPA on cerebral ischemia-induced shedding of LRP's ectodomain. (A) Number of LRP-positive vascular structures in wild-type (WT) and tPA−/− mice in the 3 AOIs 24 hours after MCAO. A subset of tPA−/− mice was intracerebrally injected with murine tPA immediately after MCAO (tPA−/− plus tPA). Error bars describe standard error of the mean; n = 6; *P < .005 relative to WT and tPA−/− plus tPA. (B) Electron microscopy analysis of LRP in the NVU in the area of developing cerebral edema 24 hours after MCAO in tPA−/− mice intracerebrally injected with either PBS (i,iii) or recombinant tPA (ii,iv) immediately after MCAO. Brains were stained with the R2629 anti-LRP antibody. Arrows in panel Bii depict the presence of LRP around the blood vessel. Asterisks in panel Bii, iii, and iv denote areas of perivascular edema. A indicates astrocyte; bv, blood vessel; ec, endothelial cell. Magnification, ×5000 (i-ii) and ×30 000 (iii-iv). Images were visualized using a Hitachi H-7500 electron microscope.
Figure 7
LRP shedding from murine astrocytes exposed to OGD conditions. (A) Representative immunoblot with the R2629 antibody of cell lysates and conditioned media of astrocytes from wild-type and tPA deficient (tPA−/−) mice exposed to either normoxic or OGD conditions for 6 hours. Top panel shows LRP in the conditioned media, and lower panel represents LRP in cell lysates. Each observation was repeated 4 times. Bar graph describes mean density of the band per experimental group. Lines depict SEM. White bars represent results obtained under normoxic conditions. Black bars depict observations made under OGD conditions. †P < .001 and ¶P < .05 relative to astrocytes exposed to normoxic conditions (B) Representative immunoblot with the R2629 antibody of cell lysates and conditioned medium of astrocytes from wild-type mice exposed to either normoxia or OGD conditions, in the presence or absence of either tPA or tPA and RAP. Upper panel shows LRP in the conditioned media and lower panel represents LRP in cell lysates. Each observation was repeated 4 times. Bar graph describes mean density of the band per experimental group. Lines depict SEM. White bars represent results obtained under normoxic conditions. Black bars depict observations made under OGD conditions. ±P < .01 and ¶P < .05 relative to astrocytes exposed to normoxic conditions in absence of tPA. £P < .01 relative to astrocytes exposed to OGD conditions without tPA or with tPA plus RAP. *P < .05 relative to astrocytes exposed to OGD conditions in the absence of tPA. (C) Representative immunoblot with the R2629 antibody of cell lysates and conditioned media of astrocytes from wild-type mice exposed to either normoxia or OGD conditions, in the presence or absence of RAP. Each observation was repeated 4 times. Bar graphs describe mean density of the band for a total of 4 observations per experimental group. Lines depict SEM. White bars represent results obtained under normoxic conditions. Black bars depict observations made under OGD conditions. ⋀P < .01 relative to astrocytes maintained under normoxic conditions; ‖P < .05 relative to astrocytes exposed to OGD conditions in the absence of RAP.
Similar articles
- Tissue-type plasminogen activator and the low-density lipoprotein receptor-related protein induce Akt phosphorylation in the ischemic brain.
An J, Zhang C, Polavarapu R, Zhang X, Zhang X, Yepes M. An J, et al. Blood. 2008 Oct 1;112(7):2787-94. doi: 10.1182/blood-2008-02-141630. Epub 2008 Jul 15. Blood. 2008. PMID: 18628488 Free PMC article. - Tissue-type plasminogen activator and the low-density lipoprotein receptor-related protein mediate cerebral ischemia-induced nuclear factor-kappaB pathway activation.
Zhang X, Polavarapu R, She H, Mao Z, Yepes M. Zhang X, et al. Am J Pathol. 2007 Oct;171(4):1281-90. doi: 10.2353/ajpath.2007.070472. Epub 2007 Aug 23. Am J Pathol. 2007. PMID: 17717150 Free PMC article. - Tissue-type plasminogen activator induces opening of the blood-brain barrier via the LDL receptor-related protein.
Yepes M, Sandkvist M, Moore EG, Bugge TH, Strickland DK, Lawrence DA. Yepes M, et al. J Clin Invest. 2003 Nov;112(10):1533-40. doi: 10.1172/JCI19212. J Clin Invest. 2003. PMID: 14617754 Free PMC article. - Reprint of: Fibrinolytic and Non-fibrinolytic Roles of Tissue-type Plasminogen Activator in the Ischemic Brain.
Yepes M. Yepes M. Neuroscience. 2024 Jul 9;550:21-29. doi: 10.1016/j.neuroscience.2024.05.040. Epub 2024 Jul 2. Neuroscience. 2024. PMID: 38964373 Review. - Fibrinolytic and Non-fibrinolytic Roles of Tissue-type Plasminogen Activator in the Ischemic Brain.
Yepes M. Yepes M. Neuroscience. 2024 Mar 26;542:69-80. doi: 10.1016/j.neuroscience.2023.08.011. Epub 2023 Aug 11. Neuroscience. 2024. PMID: 37574107 Review.
Cited by
- Signaling, delivery and age as emerging issues in the benefit/risk ratio outcome of tPA For treatment of CNS ischemic disorders.
Armstead WM, Ganguly K, Kiessling JW, Riley J, Chen XH, Smith DH, Stein SC, Higazi AA, Cines DB, Bdeir K, Zaitsev S, Muzykantov VR. Armstead WM, et al. J Neurochem. 2010 Apr;113(2):303-12. doi: 10.1111/j.1471-4159.2010.06613.x. J Neurochem. 2010. PMID: 20405577 Free PMC article. Review. - Lipoprotein receptor signalling in atherosclerosis.
Mineo C. Mineo C. Cardiovasc Res. 2020 Jun 1;116(7):1254-1274. doi: 10.1093/cvr/cvz338. Cardiovasc Res. 2020. PMID: 31834409 Free PMC article. Review. - Hypoxia-ischemia or excitotoxin-induced tissue plasminogen activator- dependent gelatinase activation in mice neonate brain microvessels.
Omouendze PL, Henry VJ, Porte B, Dupré N, Carmeliet P, Gonzalez BJ, Marret S, Leroux P. Omouendze PL, et al. PLoS One. 2013 Aug 6;8(8):e71263. doi: 10.1371/journal.pone.0071263. Print 2013. PLoS One. 2013. PMID: 23940734 Free PMC article. - Plasma Hemopexin ameliorates murine spinal cord injury by switching microglia from the M1 state to the M2 state.
Han D, Yu Z, Liu W, Yin D, Pu Y, Feng J, Yuan Y, Huang A, Cao L, He C. Han D, et al. Cell Death Dis. 2018 Feb 7;9(2):181. doi: 10.1038/s41419-017-0236-8. Cell Death Dis. 2018. PMID: 29415995 Free PMC article. - Erythrocyte-bound tissue plasminogen activator is neuroprotective in experimental traumatic brain injury.
Stein SC, Ganguly K, Belfield CM, Xu X, Swanson EW, Chen XH, Browne KD, Johnson VE, Smith DH, LeBold DG, Cines DB, Muzykantov VR. Stein SC, et al. J Neurotrauma. 2009 Sep;26(9):1585-92. doi: 10.1089/neu.2008.0720. J Neurotrauma. 2009. PMID: 19331516 Free PMC article.
References
- Strickland DK, Ashcom JD, Williams S, et al. Sequence identity between the alpha 2-macroglobulin receptor and low density lipoprotein receptor-related protein suggests that this molecule is a multifunctional receptor. J Biol Chem. 1990;265:17401–17404. - PubMed
- Herz J. The LDL receptor gene family: (un)expected signal transducers in the brain. Neuron. 2001;29:571–581. - PubMed
Publication types
MeSH terms
Substances
Grants and funding
- R01 HL050784/HL/NHLBI NIH HHS/United States
- P01 HL054710/HL/NHLBI NIH HHS/United States
- R01 NS049478/NS/NINDS NIH HHS/United States
- HL 055747/HL/NHLBI NIH HHS/United States
- R01 HL055747/HL/NHLBI NIH HHS/United States
- NS 49478/NS/NINDS NIH HHS/United States
- HL 055374/HL/NHLBI NIH HHS/United States
- HL 54710/HL/NHLBI NIH HHS/United States
- R01 HL055374/HL/NHLBI NIH HHS/United States
- HL 50784/HL/NHLBI NIH HHS/United States
LinkOut - more resources
Full Text Sources
Other Literature Sources
Molecular Biology Databases
Miscellaneous


