Development of the human infant intestinal microbiota - PubMed (original) (raw)
Development of the human infant intestinal microbiota
Chana Palmer et al. PLoS Biol. 2007 Jul.
Abstract
Almost immediately after a human being is born, so too is a new microbial ecosystem, one that resides in that person's gastrointestinal tract. Although it is a universal and integral part of human biology, the temporal progression of this process, the sources of the microbes that make up the ecosystem, how and why it varies from one infant to another, and how the composition of this ecosystem influences human physiology, development, and disease are still poorly understood. As a step toward systematically investigating these questions, we designed a microarray to detect and quantitate the small subunit ribosomal RNA (SSU rRNA) gene sequences of most currently recognized species and taxonomic groups of bacteria. We used this microarray, along with sequencing of cloned libraries of PCR-amplified SSU rDNA, to profile the microbial communities in an average of 26 stool samples each from 14 healthy, full-term human infants, including a pair of dizygotic twins, beginning with the first stool after birth and continuing at defined intervals throughout the first year of life. To investigate possible origins of the infant microbiota, we also profiled vaginal and milk samples from most of the mothers, and stool samples from all of the mothers, most of the fathers, and two siblings. The composition and temporal patterns of the microbial communities varied widely from baby to baby. Despite considerable temporal variation, the distinct features of each baby's microbial community were recognizable for intervals of weeks to months. The strikingly parallel temporal patterns of the twins suggested that incidental environmental exposures play a major role in determining the distinctive characteristics of the microbial community in each baby. By the end of the first year of life, the idiosyncratic microbial ecosystems in each baby, although still distinct, had converged toward a profile characteristic of the adult gastrointestinal tract.
Conflict of interest statement
Competing interests. POB is an investigator of the Howard Hughes Medical Institute.
Figures
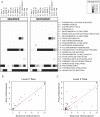
Figure 1. Comparison of Microarray- and Sequencing-Based Community Profiles
Microarray-derived and sequencing-derived data estimates of taxonomic group abundance are compared for 12 biological samples. (A) Abundance estimates for all prokMSA level 2 taxa measured on the array are compared. Each column represents a single biological sample and each row corresponds to a single taxonomic group, identified (to the right of each row) by its numerical prokMSA OTU code, along with the roughly corresponding conventional name for the group. (B) Comparison of sequence-based and microarray-based relative abundance estimates for level 2 taxonomic groups in 12 samples (same as in [A]). The _x_-axis represents the relative abundance as estimated by the frequency of clones from a given taxonomic group, and the _y_-axis represents the relative abundance as estimated by microarray profiling. (C) Same as (B) for level 3 taxonomic groups.
Figure 2. Variation in the Overall Density of Fecal Bacteria during the First Year of Life.
For each baby sample, bacterial abundance was estimated by TaqMan real-time PCR with universal bacterial primers. Estimated rRNA gene copies per gram of feces (_y_-axis) are plotted as a function of days of life (_x_-axis). Both axes are on a logarithmic scale. Abundance measurements are truncated on the lower end at the value corresponding to the 95th percentile of the extraction (negative) controls (copy number corrected by median stool mass). Episodes of antibacterial or antifungal (nystatin) treatment are indicated on the temporal axis by gray or pink bars, respectively (see Table 1 for additional information).
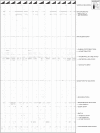
Figure 3. Overview of Microbial Community Profiles of All Samples
Each column (n = 430) represents one biological sample and each row (n = 2,149) represents one taxonomic group or species. Samples are organized in temporal order, beginning with birth at left and any maternal- or other family-derived samples at the right of each time course. Wedges above columns are numbered according to baby identifier. Rows (taxa) are sorted by their numerical codes so that subgroups of a given group lie directly below the more general group (e.g., 2.15, then 2.15.1, then 2.15.1.1). The symbols “>” and “> >” are added to the names of labeled taxonomic groups that are subgroups, at level 3 or level 4, respectively, of a labeled level 2 taxonomic group. Increasing darkness of the grayscale corresponds to higher estimated relative abundance.
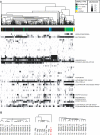
Figure 4. Clustering of Samples Based on Population Profiles of Most Common and Abundant Taxa
(A) Each column (n = 430) represents one biological sample, and each row (n = 52) represents one level 4 taxonomic group or species for which two or more samples had relative abundance estimates greater than 1%. All samples, including stool samples from the subject infants, parents, and siblings, as well as milk and vaginal samples, are represented. Samples were clustered by centered Pearson correlation, so that columns representing the most similar samples are grouped together, whereas taxonomic groups (rows) are numerically sorted rather than clustered. Increasing darkness of the grayscale corresponds to higher estimated relative abundance. Values are log2 of relative abundance. (B) Selected clusters illustrating that (1) profiles from early baby stool samples cluster by baby, (2) very early baby samples cluster with maternal samples, and (3) samples from the pair of fraternal twins cluster together and intermingle.
Figure 5. Similarity of Microbiota between Babies
For each pair of samples, we calculated the nearest-neighbor samples according to Pearson correlation of the level 4 relative abundance profiles. For each baby, we then computed what percent of nearest-neighbor samples came from each baby. The shade of grey indicates the percent of samples from baby Y (column) that were nearest neighbors of the samples from baby X (row) such that rows add to 100%.
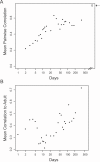
Figure 6. Temporal Patterns in Average Pairwise Similarity of Infant Stool Microbiota Profiles
(A) Similarity between infants over time. For each time point for which at least six babies were profiled, we calculated the mean pairwise Pearson correlation between the level 4 taxonomic profiles of all babies at that time point. The mean pairwise Pearson correlation between these profiles in 18 adult participants in this study (nine males and nine females) is also shown (open circle indicated by the arrow). (B) Progression towards adult-like flora over time. For each time point for which at least four babies were profiled, we calculated the mean Pearson correlation between the level 4 taxonomic profiles of all babies at that time point and a “generic adult” profile. The generic adult profile is the centroid of 18 (nine male and nine female) adults (parents in this study).
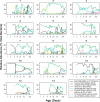
Figure 7. Temporal Profiles of the Most Abundant Level 3 Taxonomic Groups
Level 3 taxonomic groups were selected for display if their mean (normalized) relative abundance across all baby samples was greater than 1%. The _x_-axis indicates days since birth and is shown on a log scale, and the _y_-axis shows estimated (normalized) relative abundance. For some babies, no values are plotted for the first few days because the total amount of bacteria in the stool samples collected on those days was insufficient for microarray-based analysis.
Comment in
- Microbes colonize a baby's gut with distinction.
Gross L. Gross L. PLoS Biol. 2007 Jul;5(7):e191. doi: 10.1371/journal.pbio.0050191. Epub 2007 Jun 26. PLoS Biol. 2007. PMID: 20076678 Free PMC article. No abstract available.
Similar articles
- Mode of delivery affects the bacterial community in the newborn gut.
Biasucci G, Rubini M, Riboni S, Morelli L, Bessi E, Retetangos C. Biasucci G, et al. Early Hum Dev. 2010 Jul;86 Suppl 1:13-5. doi: 10.1016/j.earlhumdev.2010.01.004. Epub 2010 Feb 4. Early Hum Dev. 2010. PMID: 20133091 - Molecular analysis of colonized bacteria in a human newborn infant gut.
Park HK, Shim SS, Kim SY, Park JH, Park SE, Kim HJ, Kang BC, Kim CM. Park HK, et al. J Microbiol. 2005 Aug;43(4):345-53. J Microbiol. 2005. PMID: 16145549 - Mode of Delivery Determines Neonatal Pharyngeal Bacterial Composition and Early Intestinal Colonization.
Brumbaugh DE, Arruda J, Robbins K, Ir D, Santorico SA, Robertson CE, Frank DN. Brumbaugh DE, et al. J Pediatr Gastroenterol Nutr. 2016 Sep;63(3):320-8. doi: 10.1097/MPG.0000000000001124. J Pediatr Gastroenterol Nutr. 2016. PMID: 27035381 - Human milk and infant intestinal mucosal glycans guide succession of the neonatal intestinal microbiota.
Newburg DS, Morelli L. Newburg DS, et al. Pediatr Res. 2015 Jan;77(1-2):115-20. doi: 10.1038/pr.2014.178. Epub 2014 Oct 30. Pediatr Res. 2015. PMID: 25356747 Review. - Application of phylogenetic microarrays to interrogation of human microbiota.
Paliy O, Agans R. Paliy O, et al. FEMS Microbiol Ecol. 2012 Jan;79(1):2-11. doi: 10.1111/j.1574-6941.2011.01222.x. Epub 2011 Nov 9. FEMS Microbiol Ecol. 2012. PMID: 22092522 Free PMC article. Review.
Cited by
- Prenatal antibiotics exposure does not influence experimental allergic asthma in mice.
Lingel I, Wilburn AN, Hargis J, McAlees JW, Laumonnier Y, Chougnet CA, Deshmukh H, König P, Lewkowich IP, Schmudde I. Lingel I, et al. Front Immunol. 2022 Aug 10;13:937577. doi: 10.3389/fimmu.2022.937577. eCollection 2022. Front Immunol. 2022. PMID: 36032166 Free PMC article. - Effects of exposure to bisphenol A and ethinyl estradiol on the gut microbiota of parents and their offspring in a rodent model.
Javurek AB, Spollen WG, Johnson SA, Bivens NJ, Bromert KH, Givan SA, Rosenfeld CS. Javurek AB, et al. Gut Microbes. 2016 Nov;7(6):471-485. doi: 10.1080/19490976.2016.1234657. Epub 2016 Sep 13. Gut Microbes. 2016. PMID: 27624382 Free PMC article. - Birth mode-dependent association between pre-pregnancy maternal weight status and the neonatal intestinal microbiome.
Mueller NT, Shin H, Pizoni A, Werlang IC, Matte U, Goldani MZ, Goldani HA, Dominguez-Bello MG. Mueller NT, et al. Sci Rep. 2016 Apr 1;6:23133. doi: 10.1038/srep23133. Sci Rep. 2016. PMID: 27033998 Free PMC article. - Early Gut Microbiota Perturbations Following Intrapartum Antibiotic Prophylaxis to Prevent Group B Streptococcal Disease.
Mazzola G, Murphy K, Ross RP, Di Gioia D, Biavati B, Corvaglia LT, Faldella G, Stanton C. Mazzola G, et al. PLoS One. 2016 Jun 22;11(6):e0157527. doi: 10.1371/journal.pone.0157527. eCollection 2016. PLoS One. 2016. PMID: 27332552 Free PMC article. - The role of gut microbiota in immune homeostasis and autoimmunity.
Wu HJ, Wu E. Wu HJ, et al. Gut Microbes. 2012 Jan-Feb;3(1):4-14. doi: 10.4161/gmic.19320. Epub 2012 Jan 1. Gut Microbes. 2012. PMID: 22356853 Free PMC article. Review.
References
- Ley RE, Turnbaugh PJ, Klein S, Gordon JI. Microbial ecology: Human gut microbes associated with obesity. Nature. 2006;444:1022–1023. - PubMed
Publication types
MeSH terms
Substances
LinkOut - more resources
Full Text Sources
Other Literature Sources
Molecular Biology Databases
Research Materials
