Release of ATP in the central nervous system during systemic inflammation: real-time measurement in the hypothalamus of conscious rabbits - PubMed (original) (raw)
Release of ATP in the central nervous system during systemic inflammation: real-time measurement in the hypothalamus of conscious rabbits
Alexander V Gourine et al. J Physiol. 2007.
Abstract
Receptors for extracellular ATP (both ionotropic and metabotropic) are widely expressed in the CNS both in neurones and glia. ATP can modulate neuronal activity in many parts of the brain and contributes to the central nervous control of several physiological functions. Here we show that during the systemic inflammatory response the extracellular concentrations of ATP increase in the anterior hypothalamus and this has a profound effect on the development of the thermoregulatory febrile response. In conscious rabbits we measured ATP release in real time with novel amperometric biosensors and monitored a marked increase in the concentration of ATP (4.0 +/- 0.7 microm) in the anterior hypothalamus in response to intravenous injection of bacterial endotoxin - lipopolysaccharide (LPS). No ATP release was observed in the posterior hypothalamus. The release of ATP coincided with the development of the initial phase of the febrile response, starting 18 +/- 2 min and reaching its peak 45 +/- 2 min after LPS injection. Application of the ATP receptor antagonists pyridoxal-5'-phosphate-6-azophenyl-2',4'-disulphonic acid, Brilliant Blue G or periodate oxidized ATP dialdehyde to the site of ATP release in the anterior hypothalamus markedly augmented and prolonged the febrile response. These data indicate that during the development of the systemic inflammation, ATP is released in the anterior hypothalamus to limit the magnitude and duration of fever. This release may also have a profound effect on the hypothalamic control of other physiological functions in which ATP and related purines have been implicated to play modulatory roles, such as food intake, hormone secretion, cardiovascular activity and sleep.
Figures
Figure 1
ATP biosensors and their placements in the rabbit hypothalamus A, scheme of the sensor assembly and calibration curve of the ATP biosensor. An expanded portion of the sensor is shown to indicate the enzymatic biolayer. Note that this biolayer completely surrounds the tip of the Pt wire. Calibration curve of the ATP biosensor demonstrates linearity of ATP detection in concentrations from 1 to 50 μ
m
. B, schematic showing the placement of the sensors in the anterior hypothalamus of the rabbit. A dual recording configuration of ATP or adenosine sensor placed upon one side of the hypothalamus along with a null or inosine sensor that was placed in an equivalent position on the other side of the hypothalamus was used (see main text for details). C, histological identification of the sensor placements in the anterior (left) and posterior (right) hypothalamus. 3V, third cerebral ventricle; AH, anterior hypothalamic area; f, fornix; LH, lateral hypothalamic area; M, mammillary nuclei; MRe, mammillary recess of the third ventricle; OX, optic chiasm; SuM, supramammillary area. Arrows indicate track of the sensor.
Figure 2
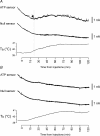
Release of ATP in the anterior hypothalamus during the development of the systemic inflammatory response in rabbits Representative raw data illustrating changes in ATP and null sensor currents and development of fever (increase in core body temperature (_T_b) shown in the bottom traces) following intravenous administration of bacterial endotoxin – lipopolysaccharide (LPS, 0.5 μg kg−1) when the sensors were placed in the anterior (A) and posterior (B) hypothalamic regions. Downward parallel shifts in the ATP and null sensor currents represent slow continuous polarization of the sensors during the whole experiment. _X_-axis denotes time after LPS injection. Arrow points to the moment when concentration of ATP starts to increase above the baseline.
Figure 3
Release of adenosine and inosine in the anterior hypothalamus during the development of the systemic inflammatory response in rabbits Raw data illustrating changes in adenosine and inosine sensor currents and development of fever (increase in core _T_b) following intravenous administration of LPS (0.5 μg kg−1). The sensors were placed in the anterior hypothalamus. Downward shifts in sensor currents represent polarization of the sensors. _X_-axis denotes time after LPS injection. Arrows point to the moments when concentrations of adenosine and inosine start to increase above the baseline.
Figure 4
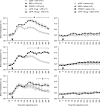
P2 receptor antagonists administered to the site of ATP release augment and prolong the febrile response during systemic inflammation in rabbits The graphs illustrate the effects of Brilliant Blue G (BBG), pyridoxal-5′-phosphate-6-azophenyl-2′,4′-disulphonic acid (PPADS) and periodate-oxidized ATP (oATP) on body temperature during systemic inflammation induced in rabbits by intravenous injection of LPS (0.5 μg kg−1). BBG (10 μg), PPADS (10 μg), oATP (10 and 100 μg) or aCSF were injected unilaterally into the anterior hypothalamus 5 min prior to LPS administration. Data are presented as means ±
s.e.m.
Numbers in parentheses indicate sample sizes. Arrowheads indicate time of injections. For presentation purposes the temperature curves of BBG + LPS, PPADS + LPS, oATP + LPS, BBG + saline, PPADS + saline, and oATP + saline are shown on separate plots along with the temperature curves of the same respective control groups (aCSF + LPS or aCSF + saline). *BBG had significant (P < 0.05) increasing effect on body temperature 75–360 min, PPADS – 150–360 min and oATP (100 μg) – 240–360 min after initiation of the febrile response by intravenous LPS challenge.
Figure 5
The effects of P2 receptor antagonists administered into the posterior hypothalamus on the febrile response during systemic inflammation in rabbits The graphs illustrate the effects of PPADS and oATP on body temperature during systemic inflammation induced in rabbits by intravenous injection of LPS (0.5 μg kg−1). PPADS (10 μg), oATP (10 and 100 μg) or aCSF were injected unilaterally into the posterior hypothalamus 5 min prior to LPS administration. Data are presented as means ±
s.e.m.
Numbers in parentheses indicate sample sizes. Arrowheads indicate time of injections. For presentation purposes the temperature curves of PPADS + LPS, oATP + LPS, PPADS + saline, and oATP + saline are shown on separate plots along with the temperature curves of the same respective control groups (aCSF + LPS or aCSF + saline). *oATP in a high dose of 100 μg had significant (P < 0.05) increasing effect on body temperature 315–360 min after LPS injection.
Similar articles
- Fever in systemic inflammation: roles of purines.
Gourine AV, Dale N, Gourine VN, Spyer KM. Gourine AV, et al. Front Biosci. 2004 Jan 1;9:1011-22. doi: 10.2741/1301. Front Biosci. 2004. PMID: 14766427 Review. - Involvement of purinergic signalling in central mechanisms of body temperature regulation in rats.
Gourine AV, Melenchuk EV, Poputnikov DM, Gourine VN, Spyer KM. Gourine AV, et al. Br J Pharmacol. 2002 Apr;135(8):2047-55. doi: 10.1038/sj.bjp.0704679. Br J Pharmacol. 2002. PMID: 11959809 Free PMC article. - P2 receptor blockade attenuates fever and cytokine responses induced by lipopolysaccharide in rats.
Gourine AV, Poputnikov DM, Zhernosek N, Melenchuk EV, Gerstberger R, Spyer KM, Gourine VN. Gourine AV, et al. Br J Pharmacol. 2005 Sep;146(1):139-45. doi: 10.1038/sj.bjp.0706287. Br J Pharmacol. 2005. PMID: 15965498 Free PMC article. - Ionotropic ATP receptors in neuronal-glial communication.
Lalo U, Verkhratsky A, Pankratov Y. Lalo U, et al. Semin Cell Dev Biol. 2011 Apr;22(2):220-8. doi: 10.1016/j.semcdb.2011.02.012. Epub 2011 Feb 12. Semin Cell Dev Biol. 2011. PMID: 21320623 Review.
Cited by
- Adenosine triggers early astrocyte reactivity that provokes microglial responses and drives the pathogenesis of sepsis-associated encephalopathy in mice.
Guo Q, Gobbo D, Zhao N, Zhang H, Awuku NO, Liu Q, Fang LP, Gampfer TM, Meyer MR, Zhao R, Bai X, Bian S, Scheller A, Kirchhoff F, Huang W. Guo Q, et al. Nat Commun. 2024 Jul 27;15(1):6340. doi: 10.1038/s41467-024-50466-y. Nat Commun. 2024. PMID: 39068155 Free PMC article. - TNAP and P2X7R: New Plasma Biomarkers for Alzheimer's Disease.
Aivar P, Bianchi C, Di Lauro C, Soria-Tobar L, Alvarez-Castelao B, Calero M, Medina M, Diaz-Hernandez M. Aivar P, et al. Int J Mol Sci. 2023 Jun 30;24(13):10897. doi: 10.3390/ijms241310897. Int J Mol Sci. 2023. PMID: 37446074 Free PMC article. - Ratiometric ECL sensor based on Apt-AuNS@Lu nanoprobe for analyzing cell swelling-induced ATP release.
Zhou F, Xiao M, Feng D, Yang P. Zhou F, et al. Mikrochim Acta. 2022 Oct 18;189(11):423. doi: 10.1007/s00604-022-05491-3. Mikrochim Acta. 2022. PMID: 36255523 - Inhibition of P2X7 Purinergic Receptor Ameliorates Fibromyalgia Syndrome by Suppressing NLRP3 Pathway.
D'Amico R, Fusco R, Siracusa R, Impellizzeri D, Peritore AF, Gugliandolo E, Interdonato L, Sforza AM, Crupi R, Cuzzocrea S, Genovese T, Cordaro M, Di Paola R. D'Amico R, et al. Int J Mol Sci. 2021 Jun 16;22(12):6471. doi: 10.3390/ijms22126471. Int J Mol Sci. 2021. PMID: 34208781 Free PMC article. - The role of NLRP3 inflammasome for microglial response to peripheral inflammation.
Garaschuk O. Garaschuk O. Neural Regen Res. 2021 Feb;16(2):294-295. doi: 10.4103/1673-5374.290889. Neural Regen Res. 2021. PMID: 32859781 Free PMC article. No abstract available.
References
- Basheer R, Strecker RE, Thakkar MM, McCarley RW. Adenosine and sleep-wake regulation. Prog Neurobiol. 2004;73:379–396. - PubMed
- Burnstock G. Physiology and pathophysiology of purinergic neurotransmission. Physiol Rev. 2007;87:659–797. - PubMed
- Conti B, Tabarean I, Andrei C, Bartfai T. Cytokines and fever. Front Biosci. 2004;9:1433–1449. - PubMed
Publication types
MeSH terms
Substances
LinkOut - more resources
Full Text Sources


