Modifying L-type calcium current kinetics: consequences for cardiac excitation and arrhythmia dynamics - PubMed (original) (raw)
Modifying L-type calcium current kinetics: consequences for cardiac excitation and arrhythmia dynamics
Aman Mahajan et al. Biophys J. 2008.
Abstract
The L-type Ca current (I(Ca,L)), essential for normal cardiac function, also regulates dynamic action potential (AP) properties that promote ventricular fibrillation. Blocking I(Ca,L) can prevent ventricular fibrillation, but only at levels suppressing contractility. We speculated that, instead of blocking I(Ca,L), modifying its shape by altering kinetic features could produce equivalent anti-fibrillatory effects without depressing contractility. To test this concept experimentally, we overexpressed a mutant Ca-insensitive calmodulin (CaM(1234)) in rabbit ventricular myocytes to inhibit Ca-dependent I(Ca,L) inactivation, combined with the ATP-sensitive K current agonist pinacidil or I(Ca,L) blocker verapamil to maintain AP duration (APD) near control levels. Cell shortening was enhanced in pinacidil-treated myocytes, but depressed in verapamil-treated myocytes. Both combinations flattened APD restitution slope and prevented APD alternans, similar to I(Ca,L) blockade. To predict the arrhythmogenic consequences, we simulated the cellular effects using a new AP model, which reproduced flattening of APD restitution slope and prevention of APD/Ca(i) transient alternans but maintained a normal Ca(i) transient. In simulated two-dimensional cardiac tissue, these changes prevented the arrhythmogenic spatially discordant APD/Ca(i) transient alternans and spiral wave breakup. These findings provide a proof-of-concept test that I(Ca,L) can be targeted to increase dynamic wave stability without depressing contractility, which may have promise as an antifibrillatory strategy.
Figures
FIGURE 1
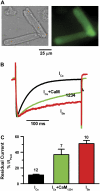
(A) Adenoviral gene transfer of Ad-CaM1234 (containing GFP) into isolated rabbit ventricular myocytes. Upper panels shows bright-field (left) and GFP images (right) of ventricular myocytes transfected with Ad-CaM1234 in vitro after cell isolation. (B) Representative normalized traces of _I_Ca during a 300 ms voltage-clamp pulse from −80 to +10 mV in a nontransfected myocyte (black) versus transfected myocyte (green), compared to a nontransfected myocyte treated with thapsigargin and ryanodine to deplete SR Ca stores, with external Ba replacing Ca as the charge carrier to eliminate CDI completely (red). Data obtained at 37°C using the perforated patch technique. (C) Average data summarizing the remaining noninactivated current (relative to peak current) at the end of the 300 ms voltage-clamp, for the number of myocytes indicated above each bar.
FIGURE 2
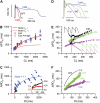
(A) Representative recordings of action potentials in current-clamped isolated rabbit ventricular myocytes transfected in vitro with either Ad-CaM1234 (blue) or Ad-CaMWT (red), compared to a nontransfected (black) myocyte. (B) The rate dependence of APD in an Ad-CaM1234 overexpressing myocyte, illustrating dramatic APD prolongation (and increased variability) at long pacing CL. Red boxes show the average at each CL. Solid lines shows the fits to the cell model simulating CaM1234's effects, assuming that _I_Ks either is not (red line labeled _Model I_Ks ↔) or is also regulating by Ca-CaM (blue line labeled _Model I_Ks ↓). (C) The dynamic APD restitution curve constructed from the data in panel B, illustrating that the maximum slope of APD restitution was reduced (0.8), in comparison to the nontransfected (black) or Ad-CaMWT overexpressing (red) myocyte (inset). (D) APD before (blue) and after 100 _μ_M pinacidil (Pin, green) or 10 _μ_M verapamil (Ver, purple) in myocytes overexpressing Ad-CaM1234, compared to a nontransfected cell (WT, black dots). Since the traces were from different myocytes, the AP amplitudes were normalized for easier comparison of the APD. (E and F) The corresponding rate dependence of APD and dynamic APD restitution curves for the cases in panel D. Insets in panel E show representative AP recordings at the dashed vertical line for each case, illustrating the alternating APD (165 vs. 115 ms) in the nontransfected myocyte, and the lack of APD alternans (120 ms vs. 120 ms Pin; 90 ms vs. 90 ms Ver) in the transfected myocytes. Numbers in panel F indicate the maximal APD restitution slope. Experiments were conducted at 35–37°C using the perforated patch technique.
FIGURE 3
(A) Average data for APD (left) and maximal APD restitution (APDR Slope, right) for the number of myocytes indicated in the following groups: nontransfected (NT) or overexpressing CaMWT (CaM), CaM1234 (_CaM_1234), CaM1234 with 10 _μ_mol/L verapamil (_CaM_1234+V) added, and CaM1234 with 100 _μ_mol/L pinacidil (_CaM_1234+P) added. Pacing CL was 400 ms in all cases except CaM1234, for was 3000 ms to illustrate the marked APD prolongation at long pacing CL. (B) The effects of pinacidil and verapamil on cell shortening (left) and the incidence of APD alternans (right) in Ad-CaM1234 overexpressing myocytes. Compared to nontransfected myocytes, pinacidil increased cell-shortening amplitude, whereas verapamil significantly depressed cell-shortening amplitude. Experiments were conducted at 37°C using the perforated patch technique.
FIGURE 4
Dependence of spiral wave dynamics on _I_Ca,L current density in the AP model. (A) Comparison of APs (upper panel), Cai transients (second panel), S1S2 restitution curves (third panel), and dynamic pacing curves (lower panel) for control parameters (black traces) and when _I_Ca,L has been decreased by 50% in the AP model (red traces). With _I_Ca,L blockade, the steady-state APD is not much affected at this CL, but the Cai transient is markedly suppressed. The S1S2 APD restitution slope (inset illustrates the pacing protocol) is shallower than in control, as is the dynamic APD restitution slope (lower panel), and APD alternans is completely eliminated (lower panel inset, APD = 166 vs. 143 ms for control and 140 vs. 140 ms for _I_Ca,L blockade). (B) Voltage snapshots at the times indicated after initiation of spiral wave reentry under control conditions. The spiral wave breaks up into multiple wavelets. Membrane voltage scale is indicated by the color bar. Last panel shows the complex trajectory of the multiple spiral wave tips. (C) After _I_Ca,L reduction, the spiral wave is stable. The core of the spiral wave undergoes stable quasiperiodic meander, as shown in the expanded tip trajectory in the last panel.
FIGURE 5
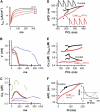
Effects of suppressing Ca-induced inactivation of _I_Ca,L in the AP model. To simulate CaM1234 overexpression, the fraction of channels α exhibiting VDI but not CDI was varied from 0.2 to 0.6. (A) Simulated current traces corresponding to _I_Ca,L during a 300 ms voltage-clamp from −80 to 0 mV, for the control (black, α = 0) and CaM1234 (red, α as labeled) cell models. (B) Steady-state action potential morphology during pacing at 400 ms PCL, simulating the following conditions: Control (black trace), CaM1234 (blue), CaM1234+ Pinacidil (CaM1234+ P, green trace), and CaM1234+ Pinacidil + Verapamil (CaM1234+ P+V, red), where CaM1234 corresponds to α = 0.3, Pinacidil to _g_katp = 0.663 mS/_μ_F, and Verapamil to _g_ca = 120 mmol/(cm C). (C) Corresponding Cai transients for the same conditions. (D and E) Rate-dependent properties of APD, end diastolic SR Ca content (CaSR), and Cai transient amplitude during steady-state pacing from 400 ms to the onset of 2:1 block, for the control (black) and CaM1234+P+V (red) cell models. Insets in panel D show AP traces during pacing at the cycle length (PCL) indicated by the arrows, demonstrating elimination of APD alternans (APD 166 ms vs. 143 ms for control, 128 ms vs. 128 ms for the CaM1234+P+V model). (F) Dynamic APD restitution curve obtained from the same data set in panel D. APD restitution slope versus DI curve is shown in the inset (dashed line indicates slope = 1.0).
FIGURE 6
(A) Spatially discordant alternans in a one-dimensional cable (4.5 cm) paced from the left end. The control cell model exhibits discordant alternans at a pacing CL = 180 ms. The blue and black line shows the APD distribution along the cable for two alternate beats at that pacing rate. Crossing of the lines indicates a node where the alternans amplitude is zero. The red line shows the APD for two successive beats for the CaM1234+P+V cell model at the fastest pacing CL before 2:1 block, which, like all other pacing CL, failed to develop APD or Cai alternans. (B) Spatially discordant alternans in APD and Cai transient amplitude in homogeneous two-dimensional tissue (4.5 cm × 4.5 cm) during pacing CL = 180 ms for the control cell model. The panels show the spatial distributions of APD (above) and Cai transient amplitude (below) for two successive beats, demonstrating two regions alternating out-of-phase with each other, separated by a nodal line (white) without alternans. (C) Same for the CaM1234 cell model, demonstrating the lack of spatially discordant alternans, even at the shortest pacing CL.
FIGURE 7
Voltage snapshots of spiral wave reentry in simulated two-dimensional tissue using the CaM1234+P+V cell model. The spiral wave, initiated at 0 ms, remains intact. The last panel shows magnified trajectory of the spiral tip, demonstrating quasiperiodic meander. Membrane voltage scale is indicated by the color bar.
Similar articles
- The mechanisms of calcium cycling and action potential dynamics in cardiac alternans.
Kanaporis G, Blatter LA. Kanaporis G, et al. Circ Res. 2015 Feb 27;116(5):846-56. doi: 10.1161/CIRCRESAHA.116.305404. Epub 2014 Dec 22. Circ Res. 2015. PMID: 25532796 Free PMC article. - Action potential duration restitution and alternans in rabbit ventricular myocytes: the key role of intracellular calcium cycling.
Goldhaber JI, Xie LH, Duong T, Motter C, Khuu K, Weiss JN. Goldhaber JI, et al. Circ Res. 2005 Mar 4;96(4):459-66. doi: 10.1161/01.RES.0000156891.66893.83. Epub 2005 Jan 20. Circ Res. 2005. PMID: 15662034 - Action potential shortening rescues atrial calcium alternans.
Kanaporis G, Kalik ZM, Blatter LA. Kanaporis G, et al. J Physiol. 2019 Feb;597(3):723-740. doi: 10.1113/JP277188. Epub 2018 Dec 5. J Physiol. 2019. PMID: 30412286 Free PMC article. - From pulsus to pulseless: the saga of cardiac alternans.
Weiss JN, Karma A, Shiferaw Y, Chen PS, Garfinkel A, Qu Z. Weiss JN, et al. Circ Res. 2006 May 26;98(10):1244-53. doi: 10.1161/01.RES.0000224540.97431.f0. Circ Res. 2006. PMID: 16728670 Review. - L-type Ca(2+) current in ventricular cardiomyocytes.
Benitah JP, Alvarez JL, Gómez AM. Benitah JP, et al. J Mol Cell Cardiol. 2010 Jan;48(1):26-36. doi: 10.1016/j.yjmcc.2009.07.026. Epub 2009 Aug 4. J Mol Cell Cardiol. 2010. PMID: 19660468 Review.
Cited by
- Accelerated inactivation of cardiac L-type calcium channels triggered by anaesthetic-induced preconditioning.
Tampo A, Hogan CS, Sedlic F, Bosnjak ZJ, Kwok WM. Tampo A, et al. Br J Pharmacol. 2009 Feb;156(3):432-43. doi: 10.1111/j.1476-5381.2008.00026.x. Epub 2009 Feb 16. Br J Pharmacol. 2009. PMID: 19154423 Free PMC article. - Action potential dynamics explain arrhythmic vulnerability in human heart failure: a clinical and modeling study implicating abnormal calcium handling.
Narayan SM, Bayer JD, Lalani G, Trayanova NA. Narayan SM, et al. J Am Coll Cardiol. 2008 Nov 25;52(22):1782-92. doi: 10.1016/j.jacc.2008.08.037. J Am Coll Cardiol. 2008. PMID: 19022157 Free PMC article. - Towards a Unified Theory of Calmodulin Regulation (Calmodulation) of Voltage-Gated Calcium and Sodium Channels.
Ben-Johny M, Dick IE, Sang L, Limpitikul WB, Kang PW, Niu J, Banerjee R, Yang W, Babich JS, Issa JB, Lee SR, Namkung H, Li J, Zhang M, Yang PS, Bazzazi H, Adams PJ, Joshi-Mukherjee R, Yue DN, Yue DT. Ben-Johny M, et al. Curr Mol Pharmacol. 2015;8(2):188-205. doi: 10.2174/1874467208666150507110359. Curr Mol Pharmacol. 2015. PMID: 25966688 Free PMC article. Review. - Arrhythmogenesis in Timothy Syndrome is associated with defects in Ca(2+)-dependent inactivation.
Dick IE, Joshi-Mukherjee R, Yang W, Yue DT. Dick IE, et al. Nat Commun. 2016 Jan 29;7:10370. doi: 10.1038/ncomms10370. Nat Commun. 2016. PMID: 26822303 Free PMC article. - The role of fine-scale anatomical structure in the dynamics of reentry in computational models of the rabbit ventricles.
Bishop MJ, Plank G. Bishop MJ, et al. J Physiol. 2012 Sep 15;590(18):4515-35. doi: 10.1113/jphysiol.2012.229062. Epub 2012 Jul 2. J Physiol. 2012. PMID: 22753546 Free PMC article.
References
- Riccio, M. L., M. L. Koller, and R. F. Gilmour, Jr. 1999. Electrical restitution and spatiotemporal organization during ventricular fibrillation. Circ. Res. 84:955–963. - PubMed
- Wu, T. J., S. F. Lin, J. N. Weiss, C. T. Ting, and P. S. Chen. 2002. Two types of ventricular fibrillation in isolated rabbit hearts: importance of excitability and action potential duration restitution. Circulation. 106:1859–1866. - PubMed
- Qu, Z., J. N. Weiss, and A. Garfinkel. 1999. Cardiac electrical restitution properties and stability of reentrant spiral waves: a simulation study. Am. J. Physiol. 45:H269–H283. - PubMed
- Goldhaber, J. I., L. H. Xie, T. Duong, C. Motter, K. Khuu, and J. N. Weiss. 2005. Action potential duration restitution and alternans in rabbit ventricular myocytes: the key role of intracellular calcium cycling. Circ. Res. 96:459–466. - PubMed
- Pastore, J. M., S. D. Girouard, K. R. Laurita, F. G. Akar, and D. S. Rosenbaum. 1999. Mechanism linking T-wave alternans to the genesis of cardiac fibrillation. Circulation. 99:1385–1394. - PubMed
Publication types
MeSH terms
Substances
LinkOut - more resources
Full Text Sources
Medical
Miscellaneous


