Slc39a14 gene encodes ZIP14, a metal/bicarbonate symporter: similarities to the ZIP8 transporter - PubMed (original) (raw)
Slc39a14 gene encodes ZIP14, a metal/bicarbonate symporter: similarities to the ZIP8 transporter
Kuppuswami Girijashanker et al. Mol Pharmacol. 2008 May.
Erratum in
- Mol Pharmacol. 2008 Sep;74(3):924
Abstract
The mouse and human genomes contain 14 highly conserved SLC39 genes. Viewed from an evolutionary perspective, SLC39A14 and SLC39A8 are the most closely related, each having three noncoding exons 1. However, SLC39A14 has two exons 4, giving rise to Zrt- and Irt-related protein (ZIP)ZIP14A and ZIP14B alternatively spliced products. C57BL/6J mouse ZIP14A expression is highest in liver, duodenum, kidney, and testis; ZIP14B expression is highest in liver, duodenum, brain, and testis; and ZIP8 is highest in lung, testis, and kidney. We studied ZIP14 stably retroviral-infected mouse fetal fibroblast cultures and transiently transfected Madin-Darby canine kidney (MDCK) polarized epithelial cells. Our findings include: 1) ZIP14-mediated cadmium uptake is proportional to cell toxicity, but manganese is not; 2) ZIP14B has a higher affinity than ZIP14A toward Cd(2+) (K(m) = 0.14 versus 1.1 microM) and Mn(2+) uptake (K(m) = 4.4 versus 18.2 microM); 3) ZIP14A- and ZIP14B-mediated Cd(2+) uptake is most inhibited by Zn(2+), and next by Mn(2+) and Cu(2+); 4) like ZIP8, ZIP14A- and ZIP14B-mediated Cd(2+) uptake is dependent on extracellular HCO(3)(-); 5) like ZIP8, ZIP14 transporters are localized on the apical surface of MDCK-ZIP cells; and 6) like ZIP8, ZIP14 proteins are glycosylated. Tissues such as intestine and liver, located between the environment and the animal, show high levels of ZIP14; given the high affinity for ZIP14, Cd(2+) is likely to act as a rogue hitchhiker-displacing Zn(2+) or Mn(2+) and entering the body to cause unwanted cell damage and disease.
Figures
Fig. 1
A, nearest-neighbor joining (NNJ)-generated phylogenetic tree of the 14 mouse and 14 human ZIP domains of the SLC39 gene-encoded proteins. These amino acid fragments were ligated, aligned, and then compared to determine percentage identity. In terms of evolution, the mouse Slc39a14 and Slc39a8 and human SLC39A14 and SLC39A8 members (large open arrows) are most closely related and diverged from one another (small arrow) sometime after the land animal-sea animal split ∼425 million years ago (see Discussion). B, structure of the mouse Slc39a14 genomic gene (introns not drawn to scale) illustrating the alternatively spliced exons 4, which encode the ZIP14A and ZIP14B proteins, respectively. Similar to Slc39a8 (Dalton et al., 2005), the Slc39a14 gene also has three alternatively spliced nontranslated exons 1. Of the nine exons (rectangles), the coding region is closed, and the 5′ and 3′ UTRs are open. The human SLC39A14 gene has the same highly conserved structure as the mouse gene, except that exons 1b and 1c have not been identified (see Table 1 and text).
Fig. 2
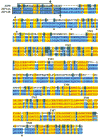
Alignment of mouse ZIP8 (top), ZIP14A (middle), and ZIP14B (bottom) proteins. The only differences between ZIP14A and ZIP14B occur in the alternatively spliced exon 4, which results in 57 amino acids (from Val151 through Glu207). ZIP8 is 73% identical to ZIP14A, and ZIP8 is 73% identical to ZIP14B (in the ZIP domain only). ZIP14A is 67% identical to ZIP14B in exon 4. Boxes show the N terminus putative membrane localization signal. Arrows denote possible cleavage sites to render the mature membrane-bound proteins. Asterisks indicate potential glycosylation sites. The eight putative transmembrane (TM) regions are underlined and denoted as “TM1” through “TM8” (labeled in each case at the left end). The precise amino acid at which a TM domain begins or ends reflects the software program and could be off by a residue or two; there are no experimental data to support this. The mouse and human ZIP14 transporter proteins comprise 489 and 492 amino acids, respectively. In contrast, the mouse and human ZIP8 proteins contain 462 and 461 amino acids, respectively. Black-on-white denotes nonsimilar residues; blue-on-cyan denotes a consensus residue derived from a block of similar residues at a given position; black-on-green denotes a consensus residue derived from the occurrence of >50% of a single residue at a given position; red-on-yellow denotes a consensus residue derived from a completely conserved residue at a given position; green-on-white denotes a residue weakly similar to a consensus residue at a given position.
Fig. 3
Comparison of ZIP14A, ZIP14B, and ZIP8 mRNA levels in six tissues of the untreated C57BL/6J mouse. Values are expressed as means ± S.E. (n = 3 mice).
Fig. 4
A, comparison of Cd2+ versus Mn2+ uptake kinetics by retroviral (rv) stably transfected MFF cultures in HBSS. Cells were exposed to 0.25 _μ_M Cd2+ (spiked with 109CdCl2) or 0.25 _μ_M Mn2+ (spiked with 54MnCl2) for 60 min at 37°C. rvLUC, control cells having no ZIP protein. B, semi-log plot of cell survival as a function of increasing doses of Cd2+ or Mn2+, in four rvZIP cell lines versus rvLUC control cells. Cultures were exposed to the indicated concentrations of Cd2+ or Mn2+ for 32 h at 37°C in Dulbecco's modified Eagle's medium containing 10% fetal bovine serum. After Cd2+ exposure, the rvZIP8, rvZIP14A, and rvZIP14B lines are significantly different (P < 0.001) from the rvZIP4 and rvLUC lines at all Cd2+ concentrations between 0.6 and 30 mM. After Mn2+ exposure, the rvZIP8, rvZIP14A, and rvZIP14B lines are significantly different (P < 0.05) from the rvZIP4 and rvLUC lines at all Cd2+ concentrations between 0.3 and 10 mM. Cell survival was monitored using the 3-(4,5-dimethlythiazol-2-yl)-2,5-diphenyl tetrasodium bromide assay. Values are expressed as means ± S.E. (n = 3 wells; two experiments done in different weeks).
Fig. 5
Metal cation competition for Cd2+ uptake in rvZIP14A (Z14A) versus rvZIP14B (Z14B) cells. 109CdCl2 was added to make a final Cd2+ concentration of 0.25 _μ_M; the competing metal cations (as chloride salts) at concentrations of 0, 1, 4, or 16 _μ_M were added at the same time as Cd2+, and the cells were incubated at 37°C for 20 min, after which Cd2+ accumulation was determined. Zn2+ was most inhibitory (*, P = 0.0007), with Mn2+ and Cu2+ as second most inhibitory (†, P < 0.01). No significant inhibition was seen with Cs2+, Fe2+, or Fe3+ (_P_ > 0.05). Two-tailed P values were calculated using Student's t test with 4 degrees of freedom.
Fig. 6
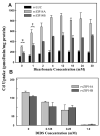
Dependence of Cd2+ uptake on HCO3− in the medium. A, Cd2+ uptake over a range from 0 to 30 mM HCO3− levels in HBSS. The black bars denote Cd2+ uptake in rvLUC control cells. At 0 mM HCO3− (*, P < 0.01) and at 1 mM HCO3− (†, P < 0.05), Cd2+ uptake by both rvZIP14A and rvZIP14B cells was significantly different from that seen at HCO3− concentration between 2 and 30 mM. B, Cd2+ uptake as a function of increasing DIDS concentrations. Cd2+ uptake by rvLUC cells was subtracted from that by the rvZIP14A or rvZIP14B cells. The transport medium contains nominal HCO3− concentrations (171 _μ_M). The DIDS solution was prepared fresh in dimethyl sulfoxide and added to the uptake medium 30 min before addition of the Cd2+. In A and B, cells were incubated with 0.25 _μ_M Cd2+, spiked with 109CdCl2, for 20 min at 37°C. At all HCO3− concentrations and all DIDS concentrations, the pH was maintained at ∼7.4, and the balance of anions and cations was carefully controlled for, as detailed in He et al. (2006).
Fig. 7
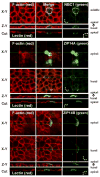
Z-stack confocal microscopy of MDCK-cell monolayers. Green fluorescent protein-NBC1 expression (top three rows); ZIP14Aha expression (next four rows); ZIP14Bha expression (bottom four rows). Two days after transfection, the confluent cells were incubated in Chelex 100 medium for 1 h, fixed with 3% formaldehyde for 20 min, and then permeabilized with 0.1% Triton X-100 for 4 min and blocked with 10% fetal bovine serum-containing PBS medium for 1 h. All of this was done at room temperature. The _α_-HA (Bethyl Laboratories, Montgomery, TX), at 1:500 dilution, was incubated at 4°C overnight with cells in 1% bovine serum albumin containing PBS. The next day, the primary antibody solution was removed and the cells were washed three times with PBS for 5 min each time. The secondary antibody Alexa 488-_α_-rabbit (causing green fluorescence) (Invitrogen) was incubated with the cells at room temperature for 1 h. Cell monolayers were then costained with either a membrane marker (F-actin) phalloidin-tetramethylrhodamine (Invitrogen) or specifically an apical membrane marker peanut agglutinin lectin (Invitrogen) at 1/250 dilution for 20 min at room temperature and then mounted for confocal analysis. The red color (F-actin or lectin) in the left column of panels, plus the green color (NBC1, ZIP14A, ZIP14B) in the right column of panels, are merged together in the middle column of panels. The x-y plane for NBC1 expression (top) was taken through the middle, whereas the x-y projections for ZIP14A (middle) and ZIP14B (bottom) were taken both through the apical and basal surfaces of the MDCK cells, as labeled. The Z-Y plane is at a right angle to the x-y plane and illustrates the basal→apical orientation of the polarized epithelial cells. The “Cut” refers to a tangential plane.
Fig. 8
Western immunoblot of proteins from control rvLUC, rvZIP14Aha, rvZIP14Bha, and rvZIP4ha—with or without PNGase F treatment. All three ZIP proteins are tagged with hemagglutinin; thus, the _α_-HA antibody was used. Rat _β_-actin protein was used to control for lane-loading. Markers (kilodaltons) are shown on the left.
Similar articles
- Tissue-Specific Induction of Mouse ZIP8 and ZIP14 Divalent Cation/Bicarbonate Symporters by, and Cytokine Response to, Inflammatory Signals.
Gálvez-Peralta M, Wang Z, Bao S, Knoell DL, Nebert DW. Gálvez-Peralta M, et al. Int J Toxicol. 2014 May;33(3):246-258. doi: 10.1177/1091581814529310. Epub 2014 Apr 10. Int J Toxicol. 2014. PMID: 24728862 Free PMC article. - ZIP14 and ZIP8 zinc/bicarbonate symporters in Xenopus oocytes: characterization of metal uptake and inhibition.
Nebert DW, Gálvez-Peralta M, Hay EB, Li H, Johansson E, Yin C, Wang B, He L, Soleimani M. Nebert DW, et al. Metallomics. 2012 Nov;4(11):1218-25. doi: 10.1039/c2mt20177a. Epub 2012 Oct 22. Metallomics. 2012. PMID: 23090441 Free PMC article. - Discovery of ZIP transporters that participate in cadmium damage to testis and kidney.
He L, Wang B, Hay EB, Nebert DW. He L, et al. Toxicol Appl Pharmacol. 2009 Aug 1;238(3):250-7. doi: 10.1016/j.taap.2009.02.017. Epub 2009 Mar 2. Toxicol Appl Pharmacol. 2009. PMID: 19265717 Free PMC article. Review. - ZIP8, member of the solute-carrier-39 (SLC39) metal-transporter family: characterization of transporter properties.
He L, Girijashanker K, Dalton TP, Reed J, Li H, Soleimani M, Nebert DW. He L, et al. Mol Pharmacol. 2006 Jul;70(1):171-80. doi: 10.1124/mol.106.024521. Epub 2006 Apr 25. Mol Pharmacol. 2006. PMID: 16638970 - [Roles of Zinc Transporters That Control the Essentiality and Toxicity of Manganese and Cadmium].
Himeno S, Fujishiro H. Himeno S, et al. Yakugaku Zasshi. 2021;141(5):695-703. doi: 10.1248/yakushi.20-00243-5. Yakugaku Zasshi. 2021. PMID: 33952754 Review. Japanese.
Cited by
- Impairment of interrelated iron- and copper homeostatic mechanisms in brain contributes to the pathogenesis of neurodegenerative disorders.
Skjørringe T, Møller LB, Moos T. Skjørringe T, et al. Front Pharmacol. 2012 Sep 25;3:169. doi: 10.3389/fphar.2012.00169. eCollection 2012. Front Pharmacol. 2012. PMID: 23055972 Free PMC article. - Molecular and pathophysiological aspects of metal ion uptake by the zinc transporter ZIP8 (SLC39A8).
Zang ZS, Xu YM, Lau ATY. Zang ZS, et al. Toxicol Res (Camb). 2016 Feb 18;5(4):987-1002. doi: 10.1039/c5tx00424a. eCollection 2016 Jul 1. Toxicol Res (Camb). 2016. PMID: 30090406 Free PMC article. Review. - Rational engineering of an elevator-type metal transporter ZIP8 reveals a conditional selectivity filter critically involved in determining substrate specificity.
Jiang Y, Li Z, Sui D, Sharma G, Wang T, MacRenaris K, Takahashi H, Merz K, Hu J. Jiang Y, et al. Commun Biol. 2023 Jul 26;6(1):778. doi: 10.1038/s42003-023-05146-w. Commun Biol. 2023. PMID: 37495662 Free PMC article. - Unraveling the structural elements of pH sensitivity and substrate binding in the human zinc transporter SLC39A2 (ZIP2).
Gyimesi G, Albano G, Fuster DG, Hediger MA, Pujol-Giménez J. Gyimesi G, et al. J Biol Chem. 2019 May 17;294(20):8046-8063. doi: 10.1074/jbc.RA118.006113. Epub 2019 Mar 26. J Biol Chem. 2019. PMID: 30914478 Free PMC article. - Iron Deficiency and Nephrotoxic Heavy Metals: A Dangerous Interplay?
Rawee P, Kremer D, Nolte IM, Leuvenink HGD, Touw DJ, De Borst MH, Bakker SJL, Hanudel MR, Eisenga MF. Rawee P, et al. Int J Mol Sci. 2023 Mar 10;24(6):5315. doi: 10.3390/ijms24065315. Int J Mol Sci. 2023. PMID: 36982393 Free PMC article. Review.
References
- Bannon DI, Abounader R, Lees PS, Bressler JP. Effect of DMT1 knockdown on iron, cadmium, and lead uptake in Caco-2 cells. Am J Physiol Cell Physiol. 2003;284:C44–C50. - PubMed
- Begum NA, Kobayashi M, Moriwaki Y, Matsumoto M, Toyoshima K, Seya T. Mycobacterium bovis BCG cell wall and lipopolysaccharide induce a novel gene, BIGM103, encoding a 7-TM protein: identification of a new protein family having Zn-transporter and Zn-metalloprotease signatures. Genomics. 2002;80:630–645. - PubMed
- Bergeron PM, Jumarie C. Reciprocal inhibition of Cd2+ and Ca2+ uptake in human intestinal crypt cells for voltage-independent Zn-activated pathways. Biochim Biophys Acta. 2006;1758:702–712. - PubMed
- Bergwitz C, Wendlandt T, Potter E, Glomb I, Gras K, von zur Muhlen A, Brabant G. A versatile chondrogenic rat calvaria cell line R-TTA-24 that permits tetracycline-regulated gene expression. Histochem Cell Biol. 2000;113:145–150. - PubMed
- Bossi E, Fabbrini MS, Ceriotti A. Exogenous protein expression in Xeno- pus oocytes: basic procedures. Methods Mol Biol. 2007;375:107–131. - PubMed
Publication types
MeSH terms
Substances
Grants and funding
- P30-ES06096/ES/NIEHS NIH HHS/United States
- P30 ES006096/ES/NIEHS NIH HHS/United States
- R01 ES010416/ES/NIEHS NIH HHS/United States
- I01 BX001000/BX/BLRD VA/United States
- R01-ES10416/ES/NIEHS NIH HHS/United States
- R01-DK62809/DK/NIDDK NIH HHS/United States
- R01 DK062809/DK/NIDDK NIH HHS/United States
LinkOut - more resources
Full Text Sources
Other Literature Sources
Molecular Biology Databases


