Lymphoproliferative disease and autoimmunity in mice with increased miR-17-92 expression in lymphocytes - PubMed (original) (raw)
Lymphoproliferative disease and autoimmunity in mice with increased miR-17-92 expression in lymphocytes
Changchun Xiao et al. Nat Immunol. 2008 Apr.
Abstract
The genomic region encoding the miR-17-92 microRNA (miRNA) cluster is often amplified in lymphoma and other cancers, and cancer cells carrying this amplification have higher expression of miRNA in this cluster. Retroviral expression of miR-17-92 accelerates c-Myc-induced lymphoma development, but precisely how higher expression of miR-17-92 promotes lymphomagenesis remains unclear. Here we generated mice with higher expression of miR-17-92 in lymphocytes. These mice developed lymphoproliferative disease and autoimmunity and died prematurely. Lymphocytes from these mice showed more proliferation and less activation-induced cell death. The miR-17-92 miRNA suppressed expression of the tumor suppressor PTEN and the proapoptotic protein Bim. This mechanism probably contributed to the lymphoproliferative disease and autoimmunity of miR-17-92-transgenic mice and contributes to lymphoma development in patients with amplifications of the miR-17-92 coding region.
Figures
Figure 1
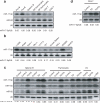
Expression of miR-17−92 miRNAs. (a) Expression of miR-17−5p and miR-92 in indicated lymphocyte or progenitor populations was determined by Northern blot. The miR-17−5p/U6 ratio in pre-B cells was arbitrarily set at 1. (b) Expression of miR-17−5p in human splenocytes and cell lines was determined by Northern blot. L1236 is a Hodgkin's lymphoma cell line; Akata, Kem-1, Oku-1, 11/17−3, and 721 are Burkitt's lymphoma cell lines. The miR-17−5p/U6 ratio in L1236 cells was arbitrarily set at 1 in (b-c). (c-d) Ectopic expression of miR-17−5p, 19a, and 92 in control, TG and TG/TG lymphoid cells and tissues were determined by Northern blot.
Figure 2
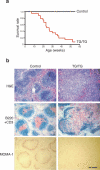
miR-17−92 transgenic mice develop hyperplasia of peripheral lymphoid tissues and have reduced life span. (a) The survival rate of 25 TG/TG and 16 control mice. (b) Haematoxylin and eosin (H&E), CD3 and B220, and MOMA-1 staining of the spleens of 20-week old TG/TG and control mice. CD3 (red) and B220 (blue), and MOMA-1 (red) staining was performed on cryo-sections, and H&E staining was performed on paraffin sections. The black bar indicates 1 mm in length.
Figure 3
Effects of elevated miR-17−92 expression levels on peripheral lymphocytes. (a) Lymphocyte subset numbers in the spleens of TG/TG and control mice. Each dot represents one mouse. (b) Flow cytometric analysis of phenotype of splenic CD4+ T and B cells in TG/TG and control mice of indicated ages. MZB, marginal zone B cells; GCB, germinal center B cells. Control mice include two hCD2-iCre mice analyzed at 7 weeks and three hCD2-iCre mice analyzed at 12 weeks. (c) Cell cycle analysis of MACS-purified peripheral CD4+ T cells from 20−45 week old mice. Percentage of cells in S-G2-M phases is graphed. Each dot represents one mouse. Bars indicate the mean values. (d) Flow cytometric analysis of phenotype of splenic B cells in TG/TG and control mice of indicated ages.
Figure 4
Autoimmunity in miR-17−92 transgenic mice. (a) Increased serum immunoglobulin concentrations in un-immunized TG/TG mice. Mice were bled at the age of 8−12 weeks and serum Ig concentrations were determined by ELISA. P values are 8.6×10⁻⁴ for IgM, 3.0×10⁻⁵ for IgG2a, 7.1×10⁻⁶ for IgG2b, and 7.3×10⁻⁴ for IgG3. (b) Serum anti-ssDNA and anti-dsDNA antibody titers in TG/TG and control mice. Mice were bled at the age of 18−25 weeks and serum autoantibody titers were determined by ELISA. The serum titers of one 26-week old MRL-lpr/lpr mouse were arbitrarily set at 1,000 for all isotypes. Serum samples with antibody titers lower than the detection limit were given arbitrary values between 1 and 2, for the graphing purpose. Each dot represents one mouse and bars indicate geometric mean values in (a) and (b). For anti-ssDNA titer, P values are 5.4×10⁻³ for IgG2a, 5.6×10⁻³ for IgG2b, 4.1×10⁻³ for IgG3; for anti-dsDNA titer, P values are 3.4×10⁻³ for IgG2a, 3.2×10⁻³ for IgG2b, 2.7×10⁻² for IgG3. (c) Haematoxylin and eosin staining of lung and salivary gland of 20-week-old TG/TG and control mice. The black bar indicates 1 mm in length. (d) Haematoxylin and eosin staining of kidneys of 20-week-old TG/TG and control mice. Shown are representative glomeruli. (e) Immunofluorescence staining of glomerular segments of 20-week-old TG/TG and controlmice. Note the accumulation of IgG (red) in the glomeruli and the presence of antinuclear antibody in the nuclei of tubular cells in the transgenic mice. The black bar in (d) and the white bar in (e) indicate 100 μm in length.
Figure 5
Enhanced proliferation and survival of miR-17−92 transgenic lymphocytes. (a) Enhanced proliferation of miR-17−92 transgenic lymphocytes. MACS-purified CD4+CD62L+ T cells and B2 cells from TG/TG and control mice were labeled with CFSE and treated with indicated stimuli. CFSE dilution was determined by flow cytometry at indicated time points. (b) Overlay of TG/TG CD4+ T cells stimulated with anti-CD3 and control CD4+ T cells stimulated with anti-CD3 and CD28 from the experiment shown in (a). (c) Cell cycle analysis of CD4+ T cells on day 2 after in vitro activation as described in (a).
Figure 6
Cytokine expression in miR-17−92 transgenic T cells. (a) Cytokine expression in CD4+ T cells MACS-purified from peripheral lymph nodes of 10−12 month-old mice, as determined by intracellular cytokine staining. Two control and three TG/TG mice were analyzed with similar results. (b) Cytokine expression in naïve CD4+CD62L+ T cells MACS-purified from 4 week-old mice and cultured for 5 days under TH1, TH2, and non-polarizing neutral conditions (THN). Two control and three TG/TG mice were analyzed with similar results.
Figure 7
miR-17−92 miRNAs control the protein expression of Pten and Bim. (a) Reduced Pten and Bim protein in TG/TG CD4**+** T cells. The Bim antibody recognizes two Bim isoforms: Bim extra long (Bim EL) and long (Bim L). (b) Average Pten/β-actin and Bim/β-actin ratios in CD4+ T cells from TG/TG and control mice. Four control and five TG/TG mice were examined at the age of 6−8 weeks. Data are presented as mean ± s.d. (c) The Pten 3’UTR and Bim 3’UTR contain multiple predicted binding sites for the miR-17−92 miRNAs. P1−4 and B1−3 are the fragments of the 3’UTRs cloned into the psiCHECK2 vector for reporter assays in (d) and (e). m1, m2, and m3 indicate mutations introduced into these fragments. See Supplementary Table 3 for details. (d) miR-17−92 down-regulates the expression of a reporter gene containing the Pten or Bim 3’UTR in NIH3T3 cells. Experiments were performed in triplicates and data are presented as mean ± s.d. Note that the s.d. values are too small to be visible on the graph for some experiments. pCXN2, the vector used to transiently express miR-17−92. P1m1, P1m2, P1m3, B2m1, and B2m2 contain mutations at individual miRNA binding sites as depicted in (c); P1m13 contains mutations m1 and m3. (e) Antisense LNA oligonucleotides up-regulate the expression of a reporter gene containing the Pten P1 or Bim B3 fragments in HeLa cells. AS, antisense.
Figure 8
Accumulation of antigen-experienced T cells and germinal center B cells in Pten and Bim compound heterozygous mice. (a) Flow cytometric analysis of splenic CD4+ T cells and B cells of mice of indicated phenotype. Three mice per genotype were analyzed at the age of 20−28 weeks with similar results. (b) Pten and Bim protein expression in splenic CD4+ T cells from mice of indicated genotypes as determined by immunoblot. (c) Intracellular staining of Pten and Bim protein in splenic CD4+ T cells of the indicated genotypes. MFI, mean fluorescence intensity.
Comment in
- MicroRNAs and lymphocyte homeostasis: dangerous eggs in a single basket.
Mérino D, Bouillet P. Mérino D, et al. Immunol Cell Biol. 2008 Jul;86(5):387-8. doi: 10.1038/icb.2008.33. Epub 2008 May 20. Immunol Cell Biol. 2008. PMID: 18490933 No abstract available.
Similar articles
- miR-155 Controls Lymphoproliferation in LAT Mutant Mice by Restraining T-Cell Apoptosis via SHIP-1/mTOR and PAK1/FOXO3/BIM Pathways.
Rouquette-Jazdanian AK, Kortum RL, Li W, Merrill RK, Nguyen PH, Samelson LE, Sommers CL. Rouquette-Jazdanian AK, et al. PLoS One. 2015 Jun 29;10(6):e0131823. doi: 10.1371/journal.pone.0131823. eCollection 2015. PLoS One. 2015. PMID: 26121028 Free PMC article. - Expression of active protein kinase B in T cells perturbs both T and B cell homeostasis and promotes inflammation.
Parsons MJ, Jones RG, Tsao MS, Odermatt B, Ohashi PS, Woodgett JR. Parsons MJ, et al. J Immunol. 2001 Jul 1;167(1):42-8. doi: 10.4049/jimmunol.167.1.42. J Immunol. 2001. PMID: 11418630 - MicroRNA-17~92 plays a causative role in lymphomagenesis by coordinating multiple oncogenic pathways.
Jin HY, Oda H, Lai M, Skalsky RL, Bethel K, Shepherd J, Kang SG, Liu WH, Sabouri-Ghomi M, Cullen BR, Rajewsky K, Xiao C. Jin HY, et al. EMBO J. 2013 Aug 28;32(17):2377-91. doi: 10.1038/emboj.2013.178. Epub 2013 Aug 6. EMBO J. 2013. PMID: 23921550 Free PMC article. - miR-17∼92 in lymphocyte development and lymphomagenesis.
Labi V, Schoeler K, Melamed D. Labi V, et al. Cancer Lett. 2019 Apr 1;446:73-80. doi: 10.1016/j.canlet.2018.12.020. Epub 2019 Jan 17. Cancer Lett. 2019. PMID: 30660648 Review. - The MYC/miR-17-92 axis in lymphoproliferative disorders: A common pathway with therapeutic potential.
Dal Bo M, Bomben R, Hernández L, Gattei V. Dal Bo M, et al. Oncotarget. 2015 Aug 14;6(23):19381-92. doi: 10.18632/oncotarget.4574. Oncotarget. 2015. PMID: 26305986 Free PMC article. Review.
Cited by
- Oncogenic microRNA 17-92 cluster is regulated by epithelial cell adhesion molecule and could be a potential therapeutic target in retinoblastoma.
Kandalam MM, Beta M, Maheswari UK, Swaminathan S, Krishnakumar S. Kandalam MM, et al. Mol Vis. 2012;18:2279-87. Epub 2012 Aug 28. Mol Vis. 2012. PMID: 22969266 Free PMC article. - MIR141 Expression Differentiates Hashimoto Thyroiditis from PTC and Benign Thyrocytes in Irish Archival Thyroid Tissues.
Dorris ER, Smyth P, O'Leary JJ, Sheils O. Dorris ER, et al. Front Endocrinol (Lausanne). 2012 Sep 3;3:102. doi: 10.3389/fendo.2012.00102. eCollection 2012. Front Endocrinol (Lausanne). 2012. PMID: 22969748 Free PMC article. - MicroRNAs in myeloproliferative neoplasms.
Zhan H, Cardozo C, Raza A. Zhan H, et al. Br J Haematol. 2013 May;161(4):471-83. doi: 10.1111/bjh.12276. Epub 2013 Feb 25. Br J Haematol. 2013. PMID: 23432162 Free PMC article. Review. - Epigenetics of the antibody response.
Li G, Zan H, Xu Z, Casali P. Li G, et al. Trends Immunol. 2013 Sep;34(9):460-70. doi: 10.1016/j.it.2013.03.006. Epub 2013 May 2. Trends Immunol. 2013. PMID: 23643790 Free PMC article. Review. - microRNA involvement in human cancer.
Iorio MV, Croce CM. Iorio MV, et al. Carcinogenesis. 2012 Jun;33(6):1126-33. doi: 10.1093/carcin/bgs140. Epub 2012 Apr 3. Carcinogenesis. 2012. PMID: 22491715 Free PMC article. Review.
References
- Goodnow CC. Multistep pathogenesis of autoimmune disease. Cell. 2007;130:25–35. - PubMed
- Hanahan D, Weinberg RA. The hallmarks of cancer. Cell. 2000;100:57–70. - PubMed
- Di Cristofano A, Pesce B, Cordon-Cardo C, Pandolfi PP. Pten is essential for embryonic development and tumour suppression. Nat Genet. 1998;19:348–55. - PubMed
- Suzuki A, et al. High cancer susceptibility and embryonic lethality associated with mutation of the PTEN tumor suppressor gene in mice. Curr Biol. 1998;8:1169–78. - PubMed
Publication types
MeSH terms
Substances
Grants and funding
- R01 AI064345-03/AI/NIAID NIH HHS/United States
- R01 AI064345-02/AI/NIAID NIH HHS/United States
- R01 AI064345/AI/NIAID NIH HHS/United States
- R01 AI064345-01/AI/NIAID NIH HHS/United States
- AI064345/AI/NIAID NIH HHS/United States
LinkOut - more resources
Full Text Sources
Other Literature Sources
Medical
Molecular Biology Databases
Research Materials


