Notch signaling mediates hypoxia-induced tumor cell migration and invasion - PubMed (original) (raw)
Notch signaling mediates hypoxia-induced tumor cell migration and invasion
Cecilia Sahlgren et al. Proc Natl Acad Sci U S A. 2008.
Abstract
Tumor hypoxia is linked to increased metastatic potential, but the molecular mechanisms coupling hypoxia to metastasis are poorly understood. Here, we show that Notch signaling is required to convert the hypoxic stimulus into epithelial-mesenchymal transition (EMT), increased motility, and invasiveness. Inhibition of Notch signaling abrogated hypoxia-induced EMT and invasion, and, conversely, an activated form of Notch could substitute for hypoxia to induce these processes. Notch signaling deploys two distinct mechanisms that act in synergy to control the expression of Snail-1, a critical regulator of EMT. First, Notch directly up-regulated Snail-1 expression by recruitment of the Notch intracellular domain to the Snail-1 promoter, and second, Notch potentiated hypoxia-inducible factor 1alpha (HIF-1alpha) recruitment to the lysyl oxidase (LOX) promoter and elevated the hypoxia-induced up-regulation of LOX, which stabilizes the Snail-1 protein. In sum, these data demonstrate a complex integration of the hypoxia and Notch signaling pathways in regulation of EMT and open up perspectives for pharmacological intervention with hypoxiainduced EMT and cell invasiveness in tumors.
Conflict of interest statement
The authors declare no conflict of interest.
Figures
Fig. 1.
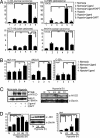
Hypoxia potentiates Notch signaling in tumor cells. (A) C-33 A, HCT-116, U-87 MG, and SKOV-3 cells cocultured with 3T3-Babe (3T3-B) or 3T3-Jagged (ligand) cells kept at normoxia or hypoxia in the presence or absence of the γ-secretase inhibitor (DAPT), as indicated. Notch activity was measured by 12XCSL-luc activation. (B) Expression of Notch downstream genes (Hey1, Hes1, or Hey2, as indicated) measured by quantitative PCR in HCT-116, SKOV-3, and C-33 A cells activated by coculture as above, in normoxia or hypoxia. (C) (Left) SKOV-3 cells, immunopreciptated for activated Notch 1 after coculture with 3T3-B or 3T3-Jagged (3T3-J) cells kept at normoxia or hypoxia in the absence or presence of GSI (Right). Western blot of N1ICD and β-actin expression in SKOV-3 cells subjected to normoxia (N) or hypoxia for 5, 24, 48, or 72 h. For the immunoprecipitation experiment (Left), the β-actin control is run on a separate gel. (D) (Left) Quantitative PCR analysis of Delta-like 1 (Dll1) mRNA expression in SKOV-3 cells kept at normoxia or hypoxia for 5, 24, 48, or 72 h. (Center) Western blot showing expression of DLL1 in normoxia and hypoxia. (Right) Quantitative PCR analysis of Hes 1 mRNA expression in SKOV-3 cells kept at normoxia or hypoxia for 24, 48, or 72 h. Note that in this experiment, a small up-regulation of Hes1 expression was observed already at 24 h, which is in contrast to the data in B, suggesting that Hes1 up-regulation may be somewhat variable. Values are presented as mRNA expression relative to expression of β_-actin_ mRNA. Values are significant at **, P < 0.01 and *, P < 0.05, as indicated in the figure. Graphs represent average of three (A and B) or two (D) independent experiments.
Fig. 2.
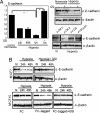
Hypoxia-mediated EMT requires Notch. (A) Quantitative PCR analysis of E-cadherin mRNA expression in SKOV-3 cells kept at normoxia or treated with hypoxia for the indicated time (Left). Values represent average values of three independent experiments and are significant at **, P < 0.01 and *, P < 0.05 as indicated. Western blot analysis of E-cadherin protein levels in SKOV-3 cells cultured at normoxia or hypoxia in the absence or presence of GSI (Upper Right) or in SKOV-3 cells transfected with empty vector (PCMX), dnCSL, or dnMaml1 (Lower Right). (B) E-cadherin protein expression in MCF7 cells in normoxia (N) or hypoxia (Upper). E-cadherin expression in MCF10 cells grown on recombinant FC domain or recombinant Jagged, to activate Notch signaling, in normoxia and hypoxia in the presence of absence of GSI as indicated (Lower).
Fig. 3.
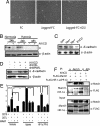
Activation of Notch can mimic hypoxia-induced EMT. (A) Phase contrast images of SKOV-3 cells grown on recombinant FC or FC-Jagged in the presence or absence of GSI in normoxia. The same number of cells was seeded in each experiment. (B) Western blot analysis of endogenous E-cadherin protein levels in SKOV-3 cells kept at normoxia or hypoxia after transfection of N1ICD. (C) Western blot analysis of E-cadherin expression in SKOV-3 cells after infection with N1ICD, Hes-1, Hey-1, or EGFP. (D) E-cadherin protein levels after cotransfection of N1ICD with dnCSL or dnMaml1 at normoxia. (E) 12XCSL-luciferase activation in 293T cells cocultured with wild-type (−) or Jagged1-expressing 293T 293T-J) cells transfected with dnMaml1, treated with hypoxia or transfected with HIF-1_α(PP-A)_. (F) Coimmunoprecipitation analysis of HIF1α–N1ICD–Maml1 interaction. Notch was immunoprecipitated from 293T cells transfected with N1ICD, FLAG-Maml1, and FLAG-HIF-1α(PP-A) as indicated, and the presence of coimmunopecipitated Maml1 and HIF-1α was detected by Western blot analysis. The input control is shown below. Values are significant at **, P < 0.01 and *, P < 0.05 as indicated.
Fig. 4.
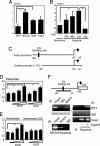
Snail-1 is a direct downstream target of Notch. (A and B) Quantitative PCR analysis of Snail-1 expression in SKOV-3 cells after adenoviral infection of N1ICD (NICD), Hes-1, Hey-1, or EGFP (A) or after exposure to hypoxia in the presence or absence of GSI (B). (C) Schematic depiction of the Snail-1 promoter constructs used in the study: the promoter containing (Snail-promoter) or lacking (Snail-promoterΔCSL) the CSL-binding site. (D) Snail1-luciferase activation by transfection of N1ICD or N1 Δ_E_. (E) Activation of the two promoter constructs shown in C by N1ICD. (F) Schematic representation of the Snail1 promoter with the amplified promoter region and the position of the CSL-binding sites denoted. Below the schematic representation, ChIP analysis of recruitment of N1ICD to the Snail-1 promoter after adenoviral infection of N1ICD into SKOV-3 cells (Upper Left) of for endogenous N1ICD after hypoxia in SKOV-3 cells (Lower Left) is shown. (Right) PCR amplification of the Snail-1 promoter after immunoprecipitation for N1ICD. ChIP analysis of recruitment of HIF-1α to the Snail-1 promoter after coculture with 3T3-Jagged1 (3T3-J) or 3T3-Babe (3T3-B) cells under normoxia or hypoxia and PCR amplification of the Snail-1 promoter after immunoprecipitation for HIF-1α are shown. Values are significant at **, P < 0.01 and *, P < 0.05, as indicated in A, B, D, and E. Values indicate the average of at least three independent experiments.
Fig. 5.
Notch signaling enhances hypoxia-induced activation of LOX transcription. (A) Quantitative PCR analysis of LOX expression in SKOV-3 cells cocultured with 3T3-Babe (3T3-B) or 3T3-Jagged (3T3-J) cells kept at normoxia or treated with hypoxia for 16 h in the absence or presence of GSI. Values are significant at **, P < 0.01 and *, P < 0.05 as indicated. Values represent the average of three independent experiments. (B) Schematic depiction of the LOX promoter with the PCR-amplified promoter region and the location of the HRE sites denoted. For the ChIP experiments, SKOV-3 cells were cocultured with either 3T3-J cells or 3T3-B cells at normoxia or hypoxia, as indicated. PCR amplification of the LOX promoter after immunoprecipitation of HIF-1α. (C) Western blot analysis of Snail-1 expressed from a heterologous promoter to analyze Snail-1 protein stability. SKOV-3 cells were transfected with wild-type Snail-1 and N1ICD or an empty vector and subjected to hypoxia in the presence or absence of the LOX inhibitor BAPN (Left). Quantification of the Western blot (Snail-1/β-actin intensity) is shown (Right).
Fig. 6.
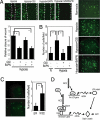
Notch signaling is required for migration and invasiveness of SKOV-3 cells. (A) Scratch wound healing assay of fluorescently labeled SKOV-3 cells cultured at hypoxia and treated with GSI, BAPN, or GSI + BAPN. Quantification of relative closure of the scratch wound compared with the control. The graph shown below represents the results of three separate experiments each performed in triplicates, where the distance of the wound is measured at four to six reference points along the scratch wound. (B) Transmembrane invasion assay of fluorescently labeled SKOV-3 cells kept at normoxia or hypoxia in the absence or presence of GSI or BAPN. (C) Adenoviral infection of N1ICD-GFP or GFP into SKOV-3 cells kept at normoxia, Quantification of the number of invading cells per field. A minimum of six fields of three separate wells within each experiment were analyzed. The graphs represent data from three (B) and two (C) separate experiments. (D) Model for how Notch controls Snail-1 at two different levels. N1ICD is recruited to the Snail-1 promoter, and we propose that HIF1α is also part of the transcriptional complex (together with CSL and Maml1). For the LOX promoter, the binding of HIF1α is potentiated by N1ICD, but N1ICD does not bind directly to the transcriptional complex. Notch is thus proposed to control Snail-1 in two different but synergistic ways, leading to elevated Snail-1 transcription and stabilization of the resulting protein.
Similar articles
- Hypoxia potentiates Notch signaling in breast cancer leading to decreased E-cadherin expression and increased cell migration and invasion.
Chen J, Imanaka N, Chen J, Griffin JD. Chen J, et al. Br J Cancer. 2010 Jan 19;102(2):351-60. doi: 10.1038/sj.bjc.6605486. Epub 2009 Dec 15. Br J Cancer. 2010. PMID: 20010940 Free PMC article. - Redox mechanisms switch on hypoxia-dependent epithelial-mesenchymal transition in cancer cells.
Cannito S, Novo E, Compagnone A, Valfrè di Bonzo L, Busletta C, Zamara E, Paternostro C, Povero D, Bandino A, Bozzo F, Cravanzola C, Bravoco V, Colombatto S, Parola M. Cannito S, et al. Carcinogenesis. 2008 Dec;29(12):2267-78. doi: 10.1093/carcin/bgn216. Epub 2008 Sep 12. Carcinogenesis. 2008. PMID: 18791199 - Notch-1-mediated esophageal carcinoma EC-9706 cell invasion and metastasis by inducing epithelial-mesenchymal transition through Snail.
Wang T, Xuan X, Pian L, Gao P, Hu H, Zheng Y, Zang W, Zhao G. Wang T, et al. Tumour Biol. 2014 Feb;35(2):1193-201. doi: 10.1007/s13277-013-1159-3. Tumour Biol. 2014. PMID: 24022665 - Crosstalk between Notch, HIF-1α and GPER in Breast Cancer EMT.
De Francesco EM, Maggiolini M, Musti AM. De Francesco EM, et al. Int J Mol Sci. 2018 Jul 10;19(7):2011. doi: 10.3390/ijms19072011. Int J Mol Sci. 2018. PMID: 29996493 Free PMC article. Review. - Blockade of Jagged/Notch pathway abrogates transforming growth factor β2-induced epithelial-mesenchymal transition in human retinal pigment epithelium cells.
Chen X, Xiao W, Liu X, Zeng M, Luo L, Wu M, Ye S, Liu Y. Chen X, et al. Curr Mol Med. 2014 May;14(4):523-34. doi: 10.2174/1566524014666140331230411. Curr Mol Med. 2014. PMID: 24694299 Review.
Cited by
- Non-canonical Notch signaling activates IL-6/JAK/STAT signaling in breast tumor cells and is controlled by p53 and IKKα/IKKβ.
Jin S, Mutvei AP, Chivukula IV, Andersson ER, Ramsköld D, Sandberg R, Lee KL, Kronqvist P, Mamaeva V, Ostling P, Mpindi JP, Kallioniemi O, Screpanti I, Poellinger L, Sahlgren C, Lendahl U. Jin S, et al. Oncogene. 2013 Oct 10;32(41):4892-902. doi: 10.1038/onc.2012.517. Epub 2012 Nov 26. Oncogene. 2013. PMID: 23178494 Free PMC article. - Notch signals in the endothelium and cancer "stem-like" cells: opportunities for cancer therapy.
Gu JW, Rizzo P, Pannuti A, Golde T, Osborne B, Miele L. Gu JW, et al. Vasc Cell. 2012 Apr 9;4:7. doi: 10.1186/2045-824X-4-7. Vasc Cell. 2012. PMID: 22487493 Free PMC article. - Targeting Notch signaling by γ-secretase inhibitor I enhances the cytotoxic effect of 5-FU in gastric cancer.
Lee HW, Kim SJ, Choi IJ, Song J, Chun KH. Lee HW, et al. Clin Exp Metastasis. 2015 Aug;32(6):593-603. doi: 10.1007/s10585-015-9730-5. Epub 2015 Jul 2. Clin Exp Metastasis. 2015. PMID: 26134677 - Phosphorylation-dependent regulation of Notch1 signaling: the fulcrum of Notch1 signaling.
Lee HJ, Kim MY, Park HS. Lee HJ, et al. BMB Rep. 2015 Aug;48(8):431-7. doi: 10.5483/bmbrep.2015.48.8.107. BMB Rep. 2015. PMID: 26058398 Free PMC article. Review. - Role of Autophagy and AMPK in Cancer Stem Cells: Therapeutic Opportunities and Obstacles in Cancer.
Kovale L, Singh MK, Kim J, Ha J. Kovale L, et al. Int J Mol Sci. 2024 Aug 8;25(16):8647. doi: 10.3390/ijms25168647. Int J Mol Sci. 2024. PMID: 39201332 Free PMC article. Review.
References
- Schindl M, et al. Overexpression of hypoxia-inducible factor 1α is associated with an unfavorable prognosis in lymph node-positive breast cancer. Clin Cancer Res. 2002;8:1831–1837. - PubMed
- Zhong H, et al. Overexpression of hypoxia-inducible factor 1α in common human cancers and their metastases. Cancer Res. 1999;59:5830–5835. - PubMed
- Christofori G. New signals from the invasive front. Nature. 2006;441:444–450. - PubMed
Publication types
MeSH terms
Substances
LinkOut - more resources
Full Text Sources
Other Literature Sources
Molecular Biology Databases
Research Materials
