PINK1 is necessary for long term survival and mitochondrial function in human dopaminergic neurons - PubMed (original) (raw)
. 2008 Jun 18;3(6):e2455.
doi: 10.1371/journal.pone.0002455.
Sonia Gandhi, Zhi Yao, Andrey Y Abramov, Erik A Miljan, Gregory Keen, Lee Stanyer, Iain Hargreaves, Kristina Klupsch, Emma Deas, Julian Downward, Louise Mansfield, Parmjit Jat, Joanne Taylor, Simon Heales, Michael R Duchen, David Latchman, Sarah J Tabrizi, Nicholas W Wood
Affiliations
- PMID: 18560593
- PMCID: PMC2413012
- DOI: 10.1371/journal.pone.0002455
PINK1 is necessary for long term survival and mitochondrial function in human dopaminergic neurons
Alison Wood-Kaczmar et al. PLoS One. 2008.
Erratum in
- PLoS ONE. 2008;3(7). doi: 10.1371/annotation/17d5aaa1-c6d8-4aad-a9a4-56b2c1220c83. Abramov, Andrey S Y [corrected to Abramov, Andrey Y]
- PLoS ONE. 2008;3(7). doi: 10.1371/annotation/ba489c2a-5cf2-481c-aff7-d2c8c4ecdcfa
Abstract
Parkinson's disease (PD) is a common age-related neurodegenerative disease and it is critical to develop models which recapitulate the pathogenic process including the effect of the ageing process. Although the pathogenesis of sporadic PD is unknown, the identification of the mendelian genetic factor PINK1 has provided new mechanistic insights. In order to investigate the role of PINK1 in Parkinson's disease, we studied PINK1 loss of function in human and primary mouse neurons. Using RNAi, we created stable PINK1 knockdown in human dopaminergic neurons differentiated from foetal ventral mesencephalon stem cells, as well as in an immortalised human neuroblastoma cell line. We sought to validate our findings in primary neurons derived from a transgenic PINK1 knockout mouse. For the first time we demonstrate an age dependent neurodegenerative phenotype in human and mouse neurons. PINK1 deficiency leads to reduced long-term viability in human neurons, which die via the mitochondrial apoptosis pathway. Human neurons lacking PINK1 demonstrate features of marked oxidative stress with widespread mitochondrial dysfunction and abnormal mitochondrial morphology. We report that PINK1 plays a neuroprotective role in the mitochondria of mammalian neurons, especially against stress such as staurosporine. In addition we provide evidence that cellular compensatory mechanisms such as mitochondrial biogenesis and upregulation of lysosomal degradation pathways occur in PINK1 deficiency. The phenotypic effects of PINK1 loss-of-function described here in mammalian neurons provides mechanistic insight into the age-related degeneration of nigral dopaminergic neurons seen in PD.
Conflict of interest statement
Competing Interests: The authors have declared that no competing interests exist.
Figures
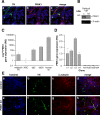
Figure 1. PINK1 Expression & Up-regulation.
A) PINK1 expression in human dopaminergic neurons. Red; PINK1, green; TH, blue; hoescht. B) Western blot showing endogenous PINK1 protein expression in control (c) and PINK1 kd (with 90% mRNA knockdown) human neuronal lysates after 5 days differentiation. Anti-PINK1 (Novus) was used to detect PINK expression; β-actin levels are shown as loading control. C) Histogram showing relative fold change in PINK1 mRNA expression levels between NSCs, 5 day differentiation (dd5), 30 day differentiation (dd30). PINK1 expression levels from pre-immortalised neural stem cells from 8 week old ventral mesencephalon (Midbrain P5) and adult human brain (Human Cb) are shown for comparison. Values represent mean of three replicate samples±s.e.m. D) Histogram showing expression of PINK1 mRNA in human neurons in four control (c1-4) and four PINK1 kd (kd1-4) selected clones relative to an endogenous control gene. RQs were normalised to that of c1; values represent mean of 3 replicate samples±standard error (s.e.m). E) Immunofluorescence images showing dopaminergic cells in control (i) and PINK1 kd (ii) human neuronal cultures after 5 days differentiation. Red; TH, green; βIII tubulin, blue; Hoecsht.
Figure 2. Long term viability is reduced in PINK1 deficient neurons.
A) Graph showing an increase in mean CI over time of human PINK1 kd neurons compared to controls. Values shown are means±s.e.m of 3 control and 4 kd cultures, each measured in triplicate. B) Graph showing an increase in mean CI over time of mouse embryonic cortical neuronal cultures taken from wild type and PINK1 knockout mice. Values shown are means±s.e.m of wild type (PINK1+/+, n = 2), and homozygote (PINK1−/−, n = 3) cultures each measured in triplicate. C,D,E) Comparison of individual cell parameters assayed by the Cytotoxicity algorithm for aged human neurons (dd 52) with PINK1 kd compared to controls, including mean nuclear size, mean nuclear intensity, plasma membrane permeability and lysosomal mass/pH. Values shown are means±s.e.m of 3 control and 4 kd cultures, each measured in triplicate. F) Histogram showing percentage apoptotic neuronal nuclei in aged control and PINK1 kd human neurons under basal conditions. Values shown are mean percentages of neuronal nuclei that are pyknotic from 10 fields of view, ±sem from 3 independent cultures.
Figure 3. Apoptosis pathway in PINK1 kd SHSY5Y cells.
A) Histogram showing a significant increase in apoptosis in PINK1 kd SHSY5Y cells in response to STS compared to controls. Cells were incubated with 60nM STS or vehicle overnight prior to analysis of annexinV/PI binding by FACS. Values represent mean of 20,000cells/well, of duplicate wells of 3 clones across 5 independent experiments±s.e.m. B) Panel a-h shows double immunofluorescence using Bax and Cox V antibodies in SHSY5Y cells treated with 0.75 µM STS. At 120 minutes, Bax (green) is seen in the cytoplasm and nucleus of control cells, with no overlap with a mitochondrial marker Cox V (red). In PINK1 kd cultures, arrows highlight two cells with evidence of nuclear condensation suggestive of apoptosis. In these cells, Bax immunofluorescence overlaps with Cox V immunofluorescence indicating Bax localisation in the mitochondria. Panel l-p shows double immunofluorescence using cytochrome c and Cox V antibodies. At 180 minutes, there is overlap of cytochrome c (green) and Cox V (red) in control cells indicating cytochrome c localisation in the mitochondria. However in PINK1 kd cells arrows indicate several apoptotic cells with diffuse cytosolic cytochrome c, indicating translocation from mitochondria to cytoplasm. Images are representative of two independent experiments with 3 clones. Images were acquired by obtaining z-stacks through cells at x63 oil objective. C) Western blot showing increased apoptosis on exposure to STS in PINK1 kd SHSY5Y cells. Cells were incubated with 0.75 µM µM STS for 6hrs. Cleaved caspase 9, cleaved caspase 3, and PARP expression is increased at earlier time points in PINK1 kd cells than in controls.
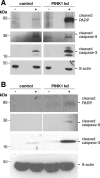
Figure 4. Apoptosis in PINK1 kd human neurons.
Western blots showing increase in basal (−) and STS-induced (+) cleaved caspase 3, cleaved caspase-9 (two bands ∼36 and ∼32 kDa) and cleaved PARP without PINK1 in young (A) (dd5) and aged (B) (dd43) human control and PINK1 kd neuronal cultures. Each lane is a sample from three pooled independent culture lysates. The lowest bands are immunoreactive degradation products which run at the foot of an SDS-PAGE gel.
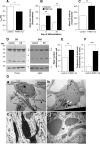
Figure 5. Mitochondrial abnormalities in PINK1 deficient neurons.
A) PINK deficiency leads to a reduced basal mitochondrial membrane potential (ψm) in young PINK1 kd neurons compared to controls, analysed using TMRM fluorescence. Values are mean percentages of the control cultures (normalised to 100%) from three independent experiments. B) Histogram showing increased uptake of the redox sensitive dye MitotrackerRed in human PINK1 kd neuronal cultures compared to controls at early and later time points. Values represent means±sem of 3 control or three PINK1 kd cultures (measured in triplicate). C) Histogram showing increased citrate synthase (CS) activity in aged (d30) PINK1 kd human neurons compared to controls. Values represent means±sem from three independent cultures. D) Western blot showing expression of mitochondrial subunits in young (D5) and aged (D43) human neurons lacking PINK1 compared to controls. Note the increase in complex subunit expression in aged neurons lacking PINK1. Replicate lanes of pooled samples from three independent cultures are shown. Expression of OXPHOS subunits C-I-20 (ND6), C-II-30 (FeS), C-III-Core-2 and C-V-α is shown. β-actin; loading control. E) Graph showing significantly increased mean number of mitochondria/cell in aged PINK1 kd human neurons compared to controls, as quantified by TEM analysis. Histogram shows mean number mitochondria per cell ±sem averaged from at least 50 cells. F) Increased frequency of abnormal mitochondria of aged human PINK1 kd neurons compared to controls, quantified using TEM. Histogram shows mean frequency of abnormal mitochondria (per total number mitochondria in each cell) ±sem, n = 50 cells. G) TEM images showing abnormal mitochondria (arrowheads) within aged (d47) human neurons lacking PINK1 (panel b, and at higher magnification in d) compared to control neurons (panel a). There are increased numbers of mitochondria within cells lacking PINK1 (panel b) compared to controls (panel A) and a higher proportion of mitochondria in PINK1 kd neurons appear swollen with disorganised christae (panels c, d). Scale bar in a,b; 10 µM, c = 500 nM.
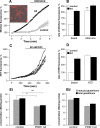
Figure 6. Free Radical Production in PINK1 knockdown neurons.
A) and (B) demonstrate a higher basal production of ROS production in mitochondria of PINK1 kd neurons compared to controls. Image in Figure 6A confirms mitochondrial localisation of Mitosox probe in neurons. Inhibition of complex 1 with rotenone induced a significant increase of ROS production in control cells. Inhibition of complex 1 in PINK1 kd cells slightly increased ROS production which is still higher than rotenone induced ROS production in control mitochondria. The basal rate of Mitosox fluorescence in control cells was taken as 100%. C) Shows an increase in the rate of HEt fluorescence in response to 50 mM KCL in control neurons. D) PINK1 kd neurons have higher basal rates of cytosolic ROS production compared to control neurons. Stimulation using KCl results in an increase in ROS production which is more marked in control than PINK1 kd neurons. E) Histogram showing decreased reduced and total glutathione concentrations in young (dd5 i) and in aged (dd43 ii) and human PINK1 kd neurons compared to controls. Values represent means ±sem from triplicates of three independent samples.
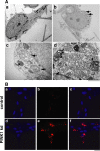
Figure 7. Abnormal lysosomal morphology in PINK1 kd neurons.
A) TEM images of vesicular aggregates within surviving aged human neurons lacking PINK1 at dd47. A control neuron is shown in panel A. Panels b-d show aggregates in PINK1 kd neurons, panel c is an aggregate enlarged from b. Scale bars; a, b; 20 µM, d; 2 µM. B) Immunofluorescence images of aged (dd47) control human neurons (panels a-c) and PINK1 kd neurons (d–f) showing lysosomal morphology (red staining; panels b and e). Nuclei are shown in blue (panels a and d), merged images presented in panels c and f. Large and multiple aggregates seen only in PINK1 kd neurons are positive for the dye Lysotracker (panel d). ,Scale bar = 20 µM
Similar articles
- PARIS induced defects in mitochondrial biogenesis drive dopamine neuron loss under conditions of parkin or PINK1 deficiency.
Pirooznia SK, Yuan C, Khan MR, Karuppagounder SS, Wang L, Xiong Y, Kang SU, Lee Y, Dawson VL, Dawson TM. Pirooznia SK, et al. Mol Neurodegener. 2020 Mar 5;15(1):17. doi: 10.1186/s13024-020-00363-x. Mol Neurodegener. 2020. PMID: 32138754 Free PMC article. - Quantitative expression proteomics and phosphoproteomics profile of brain from PINK1 knockout mice: insights into mechanisms of familial Parkinson's disease.
Triplett JC, Zhang Z, Sultana R, Cai J, Klein JB, Büeler H, Butterfield DA. Triplett JC, et al. J Neurochem. 2015 Jun;133(5):750-65. doi: 10.1111/jnc.13039. Epub 2015 Mar 1. J Neurochem. 2015. PMID: 25626353 - Silencing of PINK1 expression affects mitochondrial DNA and oxidative phosphorylation in dopaminergic cells.
Gegg ME, Cooper JM, Schapira AH, Taanman JW. Gegg ME, et al. PLoS One. 2009;4(3):e4756. doi: 10.1371/journal.pone.0004756. Epub 2009 Mar 9. PLoS One. 2009. PMID: 19270741 Free PMC article. - The mitochondrial kinase PINK1, stress response and Parkinson's disease.
Jendrach M, Gispert S, Ricciardi F, Klinkenberg M, Schemm R, Auburger G. Jendrach M, et al. J Bioenerg Biomembr. 2009 Dec;41(6):481-6. doi: 10.1007/s10863-009-9256-0. J Bioenerg Biomembr. 2009. PMID: 19941155 Review. - Mechanisms of neurodegeneration in Parkinson's disease: keep neurons in the PINK1.
Brunelli F, Valente EM, Arena G. Brunelli F, et al. Mech Ageing Dev. 2020 Jul;189:111277. doi: 10.1016/j.mad.2020.111277. Epub 2020 Jun 3. Mech Ageing Dev. 2020. PMID: 32504621 Review.
Cited by
- Parkinson's Disease: The Mitochondria-Iron Link.
Muñoz Y, Carrasco CM, Campos JD, Aguirre P, Núñez MT. Muñoz Y, et al. Parkinsons Dis. 2016;2016:7049108. doi: 10.1155/2016/7049108. Epub 2016 May 17. Parkinsons Dis. 2016. PMID: 27293957 Free PMC article. Review. - Harnessing the Therapeutic Potential of the Nrf2/Bach1 Signaling Pathway in Parkinson's Disease.
Ahuja M, Kaidery NA, Dutta D, Attucks OC, Kazakov EH, Gazaryan I, Matsumoto M, Igarashi K, Sharma SM, Thomas B. Ahuja M, et al. Antioxidants (Basel). 2022 Sep 9;11(9):1780. doi: 10.3390/antiox11091780. Antioxidants (Basel). 2022. PMID: 36139853 Free PMC article. Review. - Drug discovery in Parkinson's disease-Update and developments in the use of cellular models.
Skibinski G, Finkbeiner S. Skibinski G, et al. Int J High Throughput Screen. 2011 Jun;2011(2):15-25. doi: 10.2147/IJHTS.S8681. Int J High Throughput Screen. 2011. PMID: 23505333 Free PMC article. - Parkinson's disease: what the model systems have taught us so far.
Ghatak S, Trudler D, Dolatabadi N, Ambasudhan R. Ghatak S, et al. J Genet. 2018 Jul;97(3):729-751. J Genet. 2018. PMID: 30027906 Review. - PINK1 function in health and disease.
Deas E, Plun-Favreau H, Wood NW. Deas E, et al. EMBO Mol Med. 2009 Jun;1(3):152-65. doi: 10.1002/emmm.200900024. EMBO Mol Med. 2009. PMID: 20049715 Free PMC article. Review.
References
- de Rijk MC, Launer LJ, Berger K, Breteler MM, Dartigues JF, et al. Prevalence of Parkinson's disease in Europe: A collaborative study of population-based cohorts. Neurologic Diseases in the Elderly Research Group. Neurology. 2000;54:S21–S23. - PubMed
- Polymeropoulos MH, Lavedan C, Leroy E, Ide SE, Dehejia A, et al. Mutation in the alpha-synuclein gene identified in families with Parkinson's disease. Science. 1997;276:2045–2047. - PubMed
- Kitada T, Asakawa S, Hattori N, Matsumine H, Yamamura Y, et al. Mutations in the parkin gene cause autosomal recessive juvenile parkinsonism. Nature. 1998;392:605–608. - PubMed
- Bonifati V, Rizzu P, van Baren MJ, Schaap O, Breedveld GJ, et al. Mutations in the DJ-1 gene associated with autosomal recessive early-onset parkinsonism. Science. 2003;299:256–259. - PubMed
- Valente EM, bou-Sleiman PM, Caputo V, Muqit MM, Harvey K, et al. Hereditary early-onset Parkinson's disease caused by mutations in PINK1. Science. 2004;304:1158–1160. - PubMed
Publication types
MeSH terms
Substances
LinkOut - more resources
Full Text Sources
Other Literature Sources
Molecular Biology Databases
