Combined resveratrol, quercetin, and catechin treatment reduces breast tumor growth in a nude mouse model - PubMed (original) (raw)
Combined resveratrol, quercetin, and catechin treatment reduces breast tumor growth in a nude mouse model
Alexander Schlachterman et al. Transl Oncol. 2008 Mar.
Abstract
Grape polyphenols can act as antioxidants, antiangiogenics, and selective estrogen receptor (ER) modifiers and are therefore especially relevant for gynecological cancers such as breast cancer. The major polyphenols of red wine (resveratrol, quercetin, and catechin) have been individually shown to have anticancer properties. However, their combinatorial effect on metastatic breast cancers has not been investigated in vivo. We tested the effect of low dietary concentrations of resveratrol, quercetin, and catechin on breast cancer progression in vitro by analyzing cell proliferation and cell cycle progression. The effects of these compounds on fluorescently tagged breast tumor growth in nude mice were assessed using in situ fluorescence image analysis. Individual polyphenols at 0.5 microM neither decreased breast cancer cell proliferation nor affected cell cycle progression in vitro. However, a combination of resveratrol, quercetin, and catechin at 0.5, 5, or 20 microM each significantly reduced cell proliferation and blocked cell cycle progression in vitro. Furthermore, using in situ image analysis, we determined that combined dietary polyphenols at 0.5, 5, or 25 mg/kg reduced primary tumor growth of breast cancer xenografts in a nude mouse model. Peak inhibition was observed at 5 mg/kg. These results indicate that grape polyphenols may inhibit breast cancer progression.
Figures
Figure 1
Structures of red wine polyphenols. Structures of the stilbene resveratrol, flavan-3-ol catechin, and flavonol quercetin are compared with estrogen. These polyphenols can act as antioxidants and may have estrogenic/antiestrogenic activity due to similarity in distance between terminal hydroxyl groups of estrogen that can interact with estrogen receptors.
Figure 2
Schematic design of the animal experiments. Six-week-old female nude mice were acclimated for 2 weeks and GFP-MDA-MB-231 xenografts were inoculated at the mammary fat pad at 8 weeks of age (day 0). On day 1, mice were administered vehicle, 0.5, 5, or 25 mg/kg each of resveratrol, quercetin, and catechin thrice a week for 117 days. Fluorescence image analysis of tumors commenced on day 0 and continued twice a week until the end of the study at 118 days (32 weeks).
Figure 3
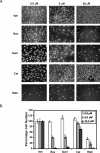
Effect of grape polyphenols on MDA-MB-231 cell proliferation. MDA-MB-231 cells at a density of 5 x 10⁴ in 5% charcoal-stripped FBS and phenol red-free media were plated on six-well plates. After 4 hours and every 48 hours for 96 hours, cells were treated with vehicle (Veh), 0.5, 5, or 20 µM resveratrol (Res), quercetin (Quer), or catechin (Cat), or a combination of 0.5, 5, or 20 µM each Res, Quer, and Cat (RQC). Cells were fixed and nuclei were stained with PI. (A) Representative micrographs of cells stained with PI. (B) Cell proliferation as analyzed by quantification of intact (nonapoptotic) nuclei. Percent viable cells ± SEM for 10 microscopic fields per triplicate treatments (N = 30) were calculated.
Figure 4
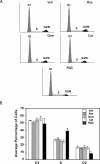
Effect of grape polyphenols on MDA-MB-231 cell cycle progression. MDA-MB-231 cells at a density of 5 x 10⁵ in 5% charcoal-stripped FBS and phenol red-free media were plated on 10-cm plates. After 4 hours and every 48 hours for 96 hours, cells were treated with vehicle (Veh), or with 0.5 µM each resveratrol (Res), quercetin (Quer), or catechin (Cat), or a combination of 0.5 µM each Res, Quer, and Cat (RQC). Cells were fixed and nuclei were stained with PI. Percentage of cells at each cell cycle stage was quantified by flow cytometry of PI-stained cells. (A) Representative histograms (FL-2A) for cells treated with vehicle or polyphenols. (B) Average percentage of cells at each cell cycle stage for vehicle or polyphenol treatment. Results shown are for N = 3 ± S.D. Asterisks indicate statistical significance (P < .05) when compared to Veh controls.
Figure 5
Effect of grape polyphenols on mouse body weight. Mice were weighed weekly. Initial and final body weights (BW) are shown. Data are represented as weight ± SEM for 10 mice per treatment group.
Figure 6
Effect of grape polyphenols on mammary tumor growth. Mice were administered with vehicle (10% ethanol in oil) or with 0.5, 5 or 25 mg/kg resveratrol, quercetin, and catechin (RQC) thrice a week. GFP-MDA-MB-231 xenografts (∼ 2 mm2) were inoculated in the right mammary fat pad of female athymic nude mice. Tumor growth was analyzed from digital fluorescent images and made relative to each image acquired on day 0 immediately following inoculation. (A) Average relative tumor growth as analyzed by the increase in pixel intensity for 10 mice per experimental group. Regions of green fluorescence from unsaturated digital images were outlined to define tumor area. Tumor area (in pixels) and average intensity were acquired using ImageJ software (NIH). (B) Representative digital images of primary GFP mammary tumors from mice treated with dietary polyphenol treatments on days 0 and 118. (C) Quantification of mammary tumor growth from digital images acquired twice a week for 118 days. Relative tumor area from mice treated with dietary treatments on day 118. Asterisks denote a statistically significant difference (P < .05) from control.
Similar articles
- Inhibition of mammary tumor growth and metastases to bone and liver by dietary grape polyphenols.
Castillo-Pichardo L, Martínez-Montemayor MM, Martínez JE, Wall KM, Cubano LA, Dharmawardhane S. Castillo-Pichardo L, et al. Clin Exp Metastasis. 2009;26(6):505-16. doi: 10.1007/s10585-009-9250-2. Epub 2009 Mar 18. Clin Exp Metastasis. 2009. PMID: 19294520 Free PMC article. - Anti-Breast Cancer Potential of Quercetin via the Akt/AMPK/Mammalian Target of Rapamycin (mTOR) Signaling Cascade.
Rivera Rivera A, Castillo-Pichardo L, Gerena Y, Dharmawardhane S. Rivera Rivera A, et al. PLoS One. 2016 Jun 10;11(6):e0157251. doi: 10.1371/journal.pone.0157251. eCollection 2016. PLoS One. 2016. PMID: 27285995 Free PMC article. - Absorption of three wine-related polyphenols in three different matrices by healthy subjects.
Goldberg DM, Yan J, Soleas GJ. Goldberg DM, et al. Clin Biochem. 2003 Feb;36(1):79-87. doi: 10.1016/s0009-9120(02)00397-1. Clin Biochem. 2003. PMID: 12554065 - Combination chemoprevention with grape antioxidants.
Singh CK, Siddiqui IA, El-Abd S, Mukhtar H, Ahmad N. Singh CK, et al. Mol Nutr Food Res. 2016 Jun;60(6):1406-15. doi: 10.1002/mnfr.201500945. Epub 2016 Mar 3. Mol Nutr Food Res. 2016. PMID: 26829056 Free PMC article. Review. - Nanoencapsulated dietary polyphenols for cancer prevention and treatment: successes and challenges.
Tabrez S, Jabir NR, Adhami VM, Khan MI, Moulay M, Kamal MA, Mukhtar H. Tabrez S, et al. Nanomedicine (Lond). 2020 May;15(11):1147-1162. doi: 10.2217/nnm-2019-0398. Epub 2020 Apr 15. Nanomedicine (Lond). 2020. PMID: 32292109 Review.
Cited by
- Phyto-polyphenols as potential inhibitors of breast cancer metastasis.
Avtanski D, Poretsky L. Avtanski D, et al. Mol Med. 2018 Jun 5;24(1):29. doi: 10.1186/s10020-018-0032-7. Mol Med. 2018. PMID: 30134816 Free PMC article. Review. - Quercetin potentiates the chemosensitivity of MCF-7 breast cancer cells to 5-fluorouracil.
Mawalizadeh F, Mohammadzadeh G, Khedri A, Rashidi M. Mawalizadeh F, et al. Mol Biol Rep. 2021 Dec;48(12):7733-7742. doi: 10.1007/s11033-021-06782-3. Epub 2021 Oct 12. Mol Biol Rep. 2021. PMID: 34637097 - Antiviral Activity of Vitis vinifera Leaf Extract against SARS-CoV-2 and HSV-1.
Zannella C, Giugliano R, Chianese A, Buonocore C, Vitale GA, Sanna G, Sarno F, Manzin A, Nebbioso A, Termolino P, Altucci L, Galdiero M, de Pascale D, Franci G. Zannella C, et al. Viruses. 2021 Jun 29;13(7):1263. doi: 10.3390/v13071263. Viruses. 2021. PMID: 34209556 Free PMC article. - Chemoprevention of Breast Cancer by Dietary Polyphenols.
Mocanu MM, Nagy P, Szöllősi J. Mocanu MM, et al. Molecules. 2015 Dec 17;20(12):22578-620. doi: 10.3390/molecules201219864. Molecules. 2015. PMID: 26694341 Free PMC article. Review. - Therapy-related acute myeloid leukemia and its prevention.
Belitsky G, Fetisov T, Kirsanov K, Lesovaya E, Vlasova O, Yakubovskaya M. Belitsky G, et al. Am J Blood Res. 2020 Dec 15;10(6):416-433. eCollection 2020. Am J Blood Res. 2020. PMID: 33489451 Free PMC article. Review.
References
- de Lorimier AA. Alcohol, wine, and health. Am J Surg. 2000;180:357–361. - PubMed
- Harris DM, Besselink E, Henning SM, Go VL, Heber D. Phytoestrogens induce differential estrogen receptor alpha- or beta-mediated responses in transfected breast cancer cells. Exp Biol Med. 2005;230:558–568. - PubMed
- Klinge CM, Risinger KE, Watts MB, Beck V, Eder R, Jungbauer A. Estrogenic activity in white and red wine extracts. J Agric Food Chem. 2003;51:1850–1857. - PubMed
- Pastrana-Bonilla E, Akoh CC, Sellappan S, Krewer G. Phenolic content and antioxidant capacity of muscadine grapes. J Agric Food Chem. 2003;51:5497–5503. - PubMed
- Soleas GJ, Grass L, Josephy PD, Goldberg DM, Diamandis EP. A comparison of the anticarcinogenic properties of four red wine polyphenols. Clin Biochem. 2002;35:119–124. - PubMed
LinkOut - more resources
Full Text Sources
Other Literature Sources


