BEST1 expression in the retinal pigment epithelium is modulated by OTX family members - PubMed (original) (raw)
BEST1 expression in the retinal pigment epithelium is modulated by OTX family members
Noriko Esumi et al. Hum Mol Genet. 2009.
Abstract
A number of genes preferentially expressed in the retinal pigment epithelium (RPE) are associated with retinal degenerative disease. One of these, BEST1, encodes bestrophin-1, a protein that when mutated causes Best macular dystrophy. As a model for RPE gene regulation, we have been studying the mechanisms that control BEST1 expression, and recently demonstrated that members of the MITF-TFE family modulate BEST1 transcription. The human BEST1 upstream region from -154 to +38 bp is sufficient to direct expression in the RPE, and positive-regulatory elements exist between -154 and -104 bp. Here, we show that the -154 to -104 bp region is necessary for RPE expression in transgenic mice and contains a predicted OTX-binding site (Site 1). Since another non-canonical OTX site (Site 2) is located nearby, we tested the function of these sites using BEST1 promoter/luciferase constructs by in vivo electroporation and found that mutation of both sites reduces promoter activity. Three OTX family proteins - OTX1, OTX2 and CRX - bound to both Sites 1 and 2 in vitro, and all of them increased BEST1 promoter activity. Surprisingly, we found that human and bovine RPE expressed not only OTX2 but also CRX, the CRX genomic region in bovine RPE was hypersensitive to DNase I, consistent with active transcription, and that both OTX2 and CRX bound to the BEST1 proximal promoter in vivo. These results demonstrate for the first time CRX expression in the RPE, and suggest that OTX2 and CRX may act as positive modulators of the BEST1 promoter in the RPE.
Figures
Figure 1.
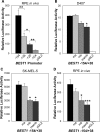
Proximal OTX-binding sites contribute to BEST1 promoter activity in vivo. (A) Promoter activity of BEST1 deletion constructs in mouse retinal pigment epithelium (RPE) in vivo. Luciferase constructs containing the BEST1 −154 to +38 bp, −136 to +38 bp, −120 to +38 bp and −104 to +38 bp fragments or empty pGL2-Basic vector, together with control pRL-CMV for normalization, were introduced into mouse RPE cells by subretinal injection followed by in vivo electroporation. Three days later, cell lysates were prepared from the posterior portion of the eyes, and luciferase activities were measured. Firefly luciferase activities were normalized by Renilla luciferase activities, and relative luciferase activities (fold increase) were calculated as the ratio of the normalized luciferase activity with constructs containing BEST1 promoter fragments to that with empty pGL2-Basic vector. After removing unsuccessful subretinal injection and in vivo electroporation, the number of valid samples for each construct were between 8 and 19. The values represent the means and SEM (bar). Statistical significance is shown by *P < 0.05, **P < 0.01 and ***P < 0.001 throughout Figure 1. (B) Effect of OTX site mutation on BEST1 promoter activity in D407. Luciferase constructs containing wild-type sequence as well as mutation of Site 1 (ma), Site 2 (mb) and both (mamb) in the context of the BEST1 −154 to +38 bp region were transfected into D407 cells together with control pRL-CMV for normalization. Relative luciferase activities (fold increase) were calculated as described in (A). Transfection experiments were performed three times independently in duplicate each time. The values represent the means and SEM (bar). Statistical significance was examined for each mutated construct compared with the wild-type construct. (C) Effect of OTX site mutation in SK-MEL-5. Experiments were performed and results are presented in the same manner as described in (B), except that SK-MEL-5 cells were used as host for transfection. (D) Effect of OTX site mutation in mouse RPE in vivo. Experimental design was the same as in (B) and (C), except that in vivo electroporation was performed to transduce plasmids into native mouse RPE. After removing unsuccessful subretinal injection and in vivo electroporation, the number of valid samples for each construct were between 7 and 18.
Figure 2.
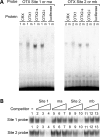
OTX family proteins bind to the BEST1 proximal promoter in vitro. (A) Electrophoretic mobility shift assay (EMSA) with OTX family proteins. (Left panel) EMSA was performed with in vitro transcribed and translated CRX, OTX1, OTX2-s, OTX2-l and control luciferase proteins and probes containing OTX Site 1, wild-type (lanes labeled ‘1’) and with ma mutation (labeled ‘m’). Radiolabeled oligonucleotide probes were incubated with 3 µl of in vitro transcribed and translated proteins in the presence of 1 µg poly (dI–dC). The film was exposed overnight without an intensifying screen. Shifted bands were observed with all OTX family proteins and the wild-type probe, but abolished when the probe was mutated. (Right panel) EMSA was performed in the same manner as in left panel, except that probes used were oligonucleotides containing OTX Site 2, wild-type (labeled ‘2’) and with mb mutation (labeled ‘m’). Shifted bands were observed with the wild-type probe and all OTX family proteins, but not with the mutated probe. (B) Cold oligomer competition. 32P-labeled Site 1 and 2 probes were mixed with 0- (lane 1), 10- (lanes 2, 5, 8 and 11), 100- (lanes 3, 6, 9 and 12) and 1000-fold (lanes 4, 7, 10 and 13) molar excess of unlabeled competitors, and then added to binding solution containing 1 µl of OTX2-s protein and 1 µg poly (dI–dC). Competitors used were oligonucleotides containing Site 1 (lanes 2–4), ma (lanes 5–7), Site 2 (lanes 8–10) and mb (lanes 11–13).
Figure 3.
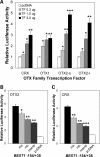
OTX factors modulate BEST1 promoter activity through proximal binding sites. (A) OTX factors transactivate the BEST1 promoter. A luciferase construct containing the BEST1 −154 to +38 bp fragment was co-transfected into D407 cells with 0, 0.3, 1.0 or 3.0 µg of expression vector for CRX, OTX1, OTX2-s or OTX2-l and pRL-TK as internal control for normalization. The amount of expression plasmid was adjusted to a total 3.0 µg for each transfection by adding empty pcDNA3.1 vector. Relative luciferase activities (fold increase) were calculated as the ratio of the normalized luciferase activity with OTX factors to that with empty pcDNA3.1 (labeled as pcDNA and defined as 1). Transfection experiments were performed three times independently in duplicate each time. The values represent the mean and SD (bar). Results were statistically analyzed for each amount of expression vector compared with empty pcDNA3.1. Statistical significance is presented by *P < 0.05, **P < 0.01 and ***P < 0.001 throughout this figure. (B) Effect of OTX site mutation on OTX2 transactivation. Luciferase constructs containing wild-type sequence and mutation ma, mb or mamb in the BEST1 −154 to +38 bp fragments were transfected into D407 cells together with an OTX2-s expression vector or empty pcDNA3.1 and pRL-TK as internal control for normalization. Relative luciferase activities (fold increase) were calculated as the ratio of the normalized luciferase activity with OTX2-s to that with empty pcDNA3.1 (defined as 1) for each luciferase construct. Transfection experiments were performed three times independently in duplicate each time. The values represent the mean and SEM (bar). Statistical significance was examined for each mutated construct compared with the wild-type construct. (C) Effect of OTX site mutation on CRX transactivation. Experimental design was the same as that described in (B) except that a CRX expression vector was used.
Figure 4.
Retinal pigment epithelium expresses both OTX2 and CRX. (A) Expression of OTX gene mRNA in human RPE and retina. The expression of CRX, OTX1 and OTX2 in human RPE primary culture and tissues of human RPE and retina was analyzed by reverse transcription-polymerase chain reaction along with control genes – RHO for retina, BEST1 for RPE and S16 for RNA quality and quantity. To confirm the specificity of PCR primers, plasmids containing each OTX cDNA were also included as template. (B) CRX expression in human RPE. The expression levels of CRX, RHO and control GAPDH were analyzed by reverse transcription-quantitative polymerase chain reaction (qPCR) in triplicates using pooled RPE and retinal RNAs prepared from human donor eyes. Based on threshold cycle (Ct) values, the expression level of CRX and RHO was normalized by that of GAPDH, and relative expression was calculated as the ratio of the normalized expression level in the RPE to that in the retina (defined as 1). The values represent the mean and SD (bar) of triplicate qPCR measurements. Difference in the relative expression in the RPE between CRX and RHO was statistically significant (***P < 0.001). (C) CRX expression in bovine RPE. RPE and retinal RNAs were extracted from bovine eyes kept on ice for 48 h, and the expression levels of CRX, RHO and control GAPDH were analyzed in the same manner as in (B). Difference in the relative expression in the RPE between CRX and RHO was statistically significant (**P < 0.01). (D) DNase I hypersensitive sites in RPE cells in vivo. RPE cell nuclei prepared from bovine eyes were digested with 0, 1, 2, 4, 8, 16, 32, 64, 128, 256 U of DNase I, and genomic DNAs of digested samples were purified and quantified. qPCR was performed using 30 ng genomic DNA of each sample with primers amplifying 200–250 bp fragments located around the TSS (−200 to +100 bp) of the indicated genes. Based on Ct values, the relative amount of PCR template in a sample was calculated as the ratio to the amount of PCR template in the undigested sample (intact DNA, defined as 1). The DNase I digestions were performed three times independently, and each sample was analyzed by qPCR in duplicate. The values represent the means. (E) Reproducibility of DNase I hypersensitive assay. The results with 16 U of DNase I shown in (D) are presented as the mean and SEM (bar) to demonstrate the reproducibility of the three biologically independent experiments. Differences were statistically analyzed for each gene compared with RHO, and statistical significance is shown by *P < 0.05 and **P < 0.01. (F) Expression of CRX protein in bovine RPE and retina. Based on the expectation that retina would contain the highest amount of CRX protein, 1000, 200 and 1000 µg of bovine RPE (lane 1), retina (lane 2) and liver (lane 3) whole cell extracts, respectively, were immunoprecipitated with anti-CRX polyclonal antibody p261 (labeled as αCRX-p). The immune-complexes were then collected with Protein A Sepharose, and bound proteins were eluted and analyzed by Western blotting with anti-CRX monoclonal antibody 4G11 (labeled as αCRX-m). As control to monitor the specificity of the IP–Western procedures, in vitro transcribed and translated CRX and OTX2 proteins (labeled as TNT; lanes 4 and 5, respectively) were also processed in parallel with the cell extracts.
Figure 5.
OTX2 and CRX bind to the BEST1 proximal promoter in vivo. (A) Chromatin immunoprecipitation (ChIP) for OTX2. ChIP was performed using bovine RPE, retina and liver with anti-OTX2 antibody ab21990, and the final chromatin precipitates as well as diluted input DNA were analyzed by quantitative polymerase chain reaction (qPCR) in duplicate using primers amplifying 100–200 bp fragments in different regions of BEST1 as indicated. Based on Ct values, relative enrichment of each genomic region was calculated as the ratio of the amount of PCR template in ChIP samples to that in the diluted input. Representative results are shown. The peak of relative enrichment was observed at the TSS region, with lower or no enrichment at the upstream and downstream regions, in the RPE but not in either the retina or liver. (B) ChIP for CRX. ChIP was performed and results are presented in the same manner as described in (A), except that anti-CRX antibody p261 was used. The relative enrichment patterns at these genomic locations were very similar to those observed with the anti-OTX2 antibody shown in (A).
Similar articles
- SOX9, through interaction with microphthalmia-associated transcription factor (MITF) and OTX2, regulates BEST1 expression in the retinal pigment epithelium.
Masuda T, Esumi N. Masuda T, et al. J Biol Chem. 2010 Aug 27;285(35):26933-26944. doi: 10.1074/jbc.M110.130294. Epub 2010 Jun 8. J Biol Chem. 2010. PMID: 20530484 Free PMC article. - Bestrophin-1 influences transepithelial electrical properties and Ca2+ signaling in human retinal pigment epithelium.
Marmorstein AD, Kinnick TR, Stanton JB, Johnson AA, Lynch RM, Marmorstein LY. Marmorstein AD, et al. Mol Vis. 2015 Apr 1;21:347-59. eCollection 2015. Mol Vis. 2015. PMID: 25878489 Free PMC article. - [Mechanisms of retinal photoreceptor cell fate determination].
Nishida A. Nishida A. Nippon Ganka Gakkai Zasshi. 2005 Nov;109(11):708-16. Nippon Ganka Gakkai Zasshi. 2005. PMID: 16363664 Review. Japanese. - The role of bestrophin-1 in intracellular Ca(2+) signaling.
Strauß O, Müller C, Reichhart N, Tamm ER, Gomez NM. Strauß O, et al. Adv Exp Med Biol. 2014;801:113-9. doi: 10.1007/978-1-4614-3209-8_15. Adv Exp Med Biol. 2014. PMID: 24664688 Review.
Cited by
- The LHX2-OTX2 transcriptional regulatory module controls retinal pigmented epithelium differentiation and underlies genetic risk for age-related macular degeneration.
Cohen-Gulkar M, David A, Messika-Gold N, Eshel M, Ovadia S, Zuk-Bar N, Idelson M, Cohen-Tayar Y, Reubinoff B, Ziv T, Shamay M, Elkon R, Ashery-Padan R. Cohen-Gulkar M, et al. PLoS Biol. 2023 Jan 17;21(1):e3001924. doi: 10.1371/journal.pbio.3001924. eCollection 2023 Jan. PLoS Biol. 2023. PMID: 36649236 Free PMC article. - Impaired Bestrophin Channel Activity in an iPSC-RPE Model of Best Vitelliform Macular Dystrophy (BVMD) from an Early Onset Patient Carrying the P77S Dominant Mutation.
Navinés-Ferrer A, Ruiz-Nogales S, Navarro R, Pomares E. Navinés-Ferrer A, et al. Int J Mol Sci. 2022 Jul 4;23(13):7432. doi: 10.3390/ijms23137432. Int J Mol Sci. 2022. PMID: 35806438 Free PMC article. - Isolation of Human Photoreceptor Precursors via a Cell Surface Marker Panel from Stem Cell-Derived Retinal Organoids and Fetal Retinae.
Lakowski J, Welby E, Budinger D, Di Marco F, Di Foggia V, Bainbridge JWB, Wallace K, Gamm DM, Ali RR, Sowden JC. Lakowski J, et al. Stem Cells. 2018 May;36(5):709-722. doi: 10.1002/stem.2775. Epub 2018 Feb 1. Stem Cells. 2018. PMID: 29327488 Free PMC article. - AAV-Txnip prolongs cone survival and vision in mouse models of retinitis pigmentosa.
Xue Y, Wang SK, Rana P, West ER, Hong CM, Feng H, Wu DM, Cepko CL. Xue Y, et al. Elife. 2021 Apr 13;10:e66240. doi: 10.7554/eLife.66240. Elife. 2021. PMID: 33847261 Free PMC article. - RIT2, a neuron-specific small guanosine triphosphatase, is expressed in retinal neuronal cells and its promoter is modulated by the POU4 transcription factors.
Zhang L, Wahlin K, Li Y, Masuda T, Yang Z, Zack DJ, Esumi N. Zhang L, et al. Mol Vis. 2013 Jun 17;19:1371-86. Print 2013. Mol Vis. 2013. PMID: 23805044 Free PMC article.
References
- Bok D. The retinal pigment epithelium: a versatile partner in vision. J. Cell Sci. Suppl. 1993;17:189–195. - PubMed
- Thumann G., Hinton D.R. Ryan S.J. Retina. 3rd edn. Vol. 3. Mosby, St. Louis, USA; 2001. Cell biology of the retinal pigment epithelium; pp. 104–121.
- Martinez-Morales J.R., Rodrigo I., Bovolenta P. Eye development: a view from the retina pigmented epithelium. Bioessays. 2004;26:766–777. - PubMed
Publication types
MeSH terms
Substances
Grants and funding
- R03 EY015410/EY/NEI NIH HHS/United States
- EY015401/EY/NEI NIH HHS/United States
- R01 EY016398/EY/NEI NIH HHS/United States
- EY016398/EY/NEI NIH HHS/United States
- EY001765/EY/NEI NIH HHS/United States
LinkOut - more resources
Full Text Sources
Molecular Biology Databases
Research Materials


