Parkin is recruited selectively to impaired mitochondria and promotes their autophagy - PubMed (original) (raw)
Parkin is recruited selectively to impaired mitochondria and promotes their autophagy
Derek Narendra et al. J Cell Biol. 2008.
Abstract
Loss-of-function mutations in Park2, the gene coding for the ubiquitin ligase Parkin, are a significant cause of early onset Parkinson's disease. Although the role of Parkin in neuron maintenance is unknown, recent work has linked Parkin to the regulation of mitochondria. Its loss is associated with swollen mitochondria and muscle degeneration in Drosophila melanogaster, as well as mitochondrial dysfunction and increased susceptibility to mitochondrial toxins in other species. Here, we show that Parkin is selectively recruited to dysfunctional mitochondria with low membrane potential in mammalian cells. After recruitment, Parkin mediates the engulfment of mitochondria by autophagosomes and the selective elimination of impaired mitochondria. These results show that Parkin promotes autophagy of damaged mitochondria and implicate a failure to eliminate dysfunctional mitochondria in the pathogenesis of Parkinson's disease.
Figures
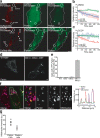
Figure 1.
Parkin accumulates on impaired mitochondria. (a and b) HEK293 cells treated with DMSO control (a) or 10 μM CCCP (b) for 1 h immunostained for endogenous Parkin (green) and a mitochondrial marker, Tom20 (red). The bottom panels show enlarged views of the boxed areas. Arrows indicate mitochondria that colocalize with endogenous Parkin. (c and d) HEK293 cells (c) and rat cortical neurons (d) depolarized with CCCP for 1 and 5 h, respectively. Cells were immunoblotted for endogenous Parkin. PNS, HM, and PHM indicate postnuclear supernatant, mitochondrial-rich heavy membrane pellet, and post–heavy membrane supernatant, respectively. VDAC is a mitochondrial marker. (e) HeLa cells expressing YFP-Parkin (green) treated with DMSO, 10 μM CCCP, or 10 μM CCCP + 10 μM oligomycin for 1 h. Cells were stained for the mitochondrial marker cytochrome c (red). Line scans below the images indicate colocalization between Parkin (green) and mitochondria (red) and correlate to the lines drawn in the images. (f) YFP-Parkin colocalization with mitochondria scored for ≥300 cells per condition in at least two experiments. (g) YFP-Parkin accumulation in mitochondrial fraction assessed as in panel c. Numbers to the right of the gel blots indicate molecular weight standards in kD. (h) HeLa cells treated with 2 mM paraquat or paraquat + 10 mM _N_-acetyl-cysteine (NAC) for 24 h scored for colocalization, as in panel f. Error bars indicate standard deviation of at least three replicates. Bars, 10 μm.
Figure 2.
FLIP analysis of Parkin diffusibility and selectivity of Parkin accumulation. (a–c) FLIP analysis with quantification after treatment with DMSO (a, top, and b) or CCCP (a, bottom, and c; n ≥ 3 in each treatment). Rectangles in panel a indicate the bleach ROI. Outlines demarcate the edges of cells expressing YFP-Parkin. (d) YFP localization in WT and Mfn1−/−,Mfn2−/− double knockout MEF cells expressing YFP-Parkin. (e) YFP-Parkin scored for colocalization as in Fig. 1 f. Error bars indicate standard deviation of at least three replicates. (f) Mfn1−/−,Mfn2−/− double knockout MEF cells transfected with YFP-Parkin (green) and pulsed with the potentiometric dye MitoTracker (blue in merge) 15 min before fixation. Cells were immunostained for cytochrome c (red). A line scan of fluorescence through two Parkin-positive mitochondria depicts colocalization between Parkin, MitoTracker, and cytochrome c. The right four panels show an enlarged view of the boxed area. Arrows indicate mitochondria (identified by anti–cytochrome c) that were depolarized (as assessed by their failure to take up the dye MitoTracker; arrowheads represent mitochondria (identified by anti–cytochrome c) that were electrochemically active (as assessed by their ability to take up the dye MitoTracker). YFP-Parkin colocalizes with depolarized mitochondria (arrows) but not with electrochemically active mitochondria. (g) The mitochondrial volume for each Mfn1−/−,Mfn2−/− MEF cell was segregated into Parkin-positive and Parkin-negative subsets. Mean MitoTracker fluorescence intensity was measured for each subset (n = 9). Bars: (a, d, and f, left) 5 μm; (f, right four panels) 1 μm.
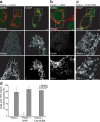
Figure 3.
Mitochondrial fragmentation does not induce Parkin accumulation independently of mitochondrial membrane potential. (a–d) HeLa cells cotransfected with YFP-Parkin (green) and with empty vector (a), vMIA (b), or Drp1 K38A (c). Cells were treated with 10 μM CCCP (a, right, and c) or DMSO (a, left, and b) for 1 h. Mitochondria were immunostained for cytochrome c (red). The bottom two panels in each column show an enlarged view of the boxed regions. (d) YFP-Parkin colocalization with mitochondria were scored as in Fig. 1 f. Error bars indicate standard deviation of at least three replicates. Bars, 5 μm.
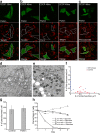
Figure 4.
Selective mitochondrial elimination by Parkin under depolarizing conditions. (a and b) HeLa cells expressing YFP-Parkin (green) incubated for 12 h (a) or 48 h (b, left) with 10 μM CCCP. Cells were immunostained for Tom20 (red). Parkin-expressing HeLa cells display less mitochondrial mass compared with surrounding cells at 12 h and complete loss of mitochondria by 48 h. (b) Similar loss of mitochondria observed with anti–cytochrome c (red, middle) and anti-TRAP1 (red, right) antibodies. (c) No loss of peroxisomes immunostained for PMP70 (red) in YFP-Parkin–transfected cells relative to surrounding untransfected cells. Outlines demarcate the edges of cells expressing YFP-Parkin. Bars, 10 μm. (d–f) Electron microscopy of untransfected HeLa cells (d) or HeLa cells expressing YFP-Parkin (e) and treated with 10 μM CCCP for 48 h. Many mitochondria and few lysosomes were observed in control cells, and no mitochondria and many lysosomes were observed in YFP-Parkin–transfected cells. Bars, 500 nm. (f) The number of mitochondria and late lysosomes/μm2 of cytoplasm in 22 randomly selected cells per condition. (g) The number of PMP70-stained peroxisomes per cell in YFP-Parkin–transfected and untransfected cells (n = 5). Error bars indicate standard deviation of at least three replicates. (h) Control HeLa cells or HeLa cells transfected with YFP-Parkin treated with 10 μM CCCP for 72 h (day 0) and cultured in glucose or galactose media for 1–4 d. Cells were fixed and stained for Tom20 and Hoechst33342 (nuclei). Cells with nonapoptotic nuclei in a representative area of the slide on days 0–4 were counted and represented in the graph as a percentage of nonapoptotic cells on day 0 (≥160 cells per condition on day 0 in at least two experiments).
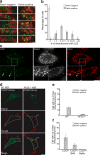
Figure 5.
Mitophagy induced by Parkin. (a) HeLa cells stably expressing GFP-LC3 (green) transfected with mCherry-Parkin (not depicted) and treated with 10 μM CCCP for 1 h. Parkin-negative cells (left) display less overlap between autophagosomes and mitochondria (red) than Parkin-positive cells (right), as assessed by (b) counting the number of mitochondria encapsulated by LC3-positive autophagosomes in >30 cells per condition in at least three independent experiments. (c) HeLa cells stably expressing GFP-LC3 (green) and transiently transfected with mCherry-Parkin (white) were immunostained for cytochrome c (red) to reveal colocalization of LC3, Parkin, and mitochondria after 1 h exposure to CCCP. Arrows indicate mitochondria that colocalize with both mCherry-Parkin and GFP-LC3. Insets show an enlarged view of the boxed areas. (d) YFP-Parkin (green)-induced mitochondrial removal after 24 h of CCCP (10 μM) exposure observed in WT MEFs (left) failed to occur in ATG5−/− MEFs (right) quantified (e) in ≥150 cells in at least three experiments. Cells were stained for Tom20 (red). Outlines demarcate the edges of cells expressing YFP-Parkin. (f) 3-methyladenine (3MA) and bafilomycin blocked Parkin-induced mitophagy in HeLa cells quantified as in panel e. Error bars indicate standard deviation of at least three replicates. Bars: (c and d) 10 μm; (a and c, insets) 1 μm.
Comment in
- Parkin mitochondria in the autophagosome.
McBride HM. McBride HM. J Cell Biol. 2008 Dec 1;183(5):757-9. doi: 10.1083/jcb.200810184. Epub 2008 Nov 24. J Cell Biol. 2008. PMID: 19029341 Free PMC article. - Damaged mitochondria get a Parkin ticket.
Short B. Short B. J Cell Biol. 2015 Mar 30;208(7):865. doi: 10.1083/jcb.2087fta. J Cell Biol. 2015. PMID: 25825513 Free PMC article.
Similar articles
- Parkin mitochondria in the autophagosome.
McBride HM. McBride HM. J Cell Biol. 2008 Dec 1;183(5):757-9. doi: 10.1083/jcb.200810184. Epub 2008 Nov 24. J Cell Biol. 2008. PMID: 19029341 Free PMC article. - Parkin-induced mitophagy in the pathogenesis of Parkinson disease.
Narendra D, Tanaka A, Suen DF, Youle RJ. Narendra D, et al. Autophagy. 2009 Jul;5(5):706-8. doi: 10.4161/auto.5.5.8505. Epub 2009 Jul 22. Autophagy. 2009. PMID: 19377297 - Proteasome and p97 mediate mitophagy and degradation of mitofusins induced by Parkin.
Tanaka A, Cleland MM, Xu S, Narendra DP, Suen DF, Karbowski M, Youle RJ. Tanaka A, et al. J Cell Biol. 2010 Dec 27;191(7):1367-80. doi: 10.1083/jcb.201007013. Epub 2010 Dec 20. J Cell Biol. 2010. PMID: 21173115 Free PMC article. - Parkin structure and function.
Seirafi M, Kozlov G, Gehring K. Seirafi M, et al. FEBS J. 2015 Jun;282(11):2076-88. doi: 10.1111/febs.13249. Epub 2015 Mar 16. FEBS J. 2015. PMID: 25712550 Free PMC article. Review. - Parkin-mediated selective mitochondrial autophagy, mitophagy: Parkin purges damaged organelles from the vital mitochondrial network.
Tanaka A. Tanaka A. FEBS Lett. 2010 Apr 2;584(7):1386-92. doi: 10.1016/j.febslet.2010.02.060. Epub 2010 Feb 25. FEBS Lett. 2010. PMID: 20188730 Free PMC article. Review.
Cited by
- Mitoflash altered by metabolic stress in insulin-resistant skeletal muscle.
Ding Y, Fang H, Shang W, Xiao Y, Sun T, Hou N, Pan L, Sun X, Ma Q, Zhou J, Wang X, Zhang X, Cheng H. Ding Y, et al. J Mol Med (Berl). 2015 Oct;93(10):1119-30. doi: 10.1007/s00109-015-1278-y. Epub 2015 Apr 25. J Mol Med (Berl). 2015. PMID: 25908643 Free PMC article. - Fluid Mechanical Forces and Endothelial Mitochondria: A Bioengineering Perspective.
Scheitlin CG, Nair DM, Crestanello JA, Zweier JL, Alevriadou BR. Scheitlin CG, et al. Cell Mol Bioeng. 2014 Dec;7(4):483-496. doi: 10.1007/s12195-014-0357-4. Cell Mol Bioeng. 2014. PMID: 25530817 Free PMC article. - Mitochondrial Function in Enamel Development.
Costiniti V, Bomfim GH, Li Y, Mitaishvili E, Ye ZW, Zhang J, Townsend DM, Giacomello M, Lacruz RS. Costiniti V, et al. Front Physiol. 2020 May 29;11:538. doi: 10.3389/fphys.2020.00538. eCollection 2020. Front Physiol. 2020. PMID: 32547417 Free PMC article. - Electron microscopic analysis of a spherical mitochondrial structure.
Ding WX, Li M, Biazik JM, Morgan DG, Guo F, Ni HM, Goheen M, Eskelinen EL, Yin XM. Ding WX, et al. J Biol Chem. 2012 Dec 7;287(50):42373-8. doi: 10.1074/jbc.M112.413674. Epub 2012 Oct 23. J Biol Chem. 2012. PMID: 23093403 Free PMC article. - Progress in the molecular pathogenesis and nucleic acid therapeutics for Parkinson's disease in the precision medicine era.
Li D, Mastaglia FL, Fletcher S, Wilton SD. Li D, et al. Med Res Rev. 2020 Nov;40(6):2650-2681. doi: 10.1002/med.21718. Epub 2020 Aug 6. Med Res Rev. 2020. PMID: 32767426 Free PMC article. Review.
References
- Abou-Sleiman, P.M., M.M. Muqit, and N.W. Wood. 2006. Expanding insights of mitochondrial dysfunction in Parkinson's disease. Nat. Rev. Neurosci. 7:207–219. - PubMed
- Bampton, E.T., C.G. Goemans, D. Niranjan, N. Mizushima, and A.M. Tolkovsky. 2005. The dynamics of autophagy visualized in live cells: from autophagosome formation to fusion with endo/lysosomes. Autophagy. 1:23–36. - PubMed
- Brooks, A.I., C.A. Chadwick, H.A. Gelbard, D.A. Cory-Slechta, and H.J. Federoff. 1999. Paraquat elicited neurobehavioral syndrome caused by dopaminergic neuron loss. Brain Res. 823:1–10. - PubMed
- Chen, H., A. Chomyn, and D.C. Chan. 2005. Disruption of fusion results in mitochondrial heterogeneity and dysfunction. J. Biol. Chem. 280:26185–26192. - PubMed
- Clark, I.E., M.W. Dodson, C. Jiang, J.H. Cao, J.R. Huh, J.H. Seol, S.J. Yoo, B.A. Hay, and M. Guo. 2006. Drosophila pink1 is required for mitochondrial function and interacts genetically with parkin. Nature. 441(7097):1162–1166. - PubMed
Publication types
MeSH terms
Substances
LinkOut - more resources
Full Text Sources
Other Literature Sources
Medical
Molecular Biology Databases
Research Materials
Miscellaneous


