Input-output behavior of ErbB signaling pathways as revealed by a mass action model trained against dynamic data - PubMed (original) (raw)
Input-output behavior of ErbB signaling pathways as revealed by a mass action model trained against dynamic data
William W Chen et al. Mol Syst Biol. 2009.
Abstract
The ErbB signaling pathways, which regulate diverse physiological responses such as cell survival, proliferation and motility, have been subjected to extensive molecular analysis. Nonetheless, it remains poorly understood how different ligands induce different responses and how this is affected by oncogenic mutations. To quantify signal flow through ErbB-activated pathways we have constructed, trained and analyzed a mass action model of immediate-early signaling involving ErbB1-4 receptors (EGFR, HER2/Neu2, ErbB3 and ErbB4), and the MAPK and PI3K/Akt cascades. We find that parameter sensitivity is strongly dependent on the feature (e.g. ERK or Akt activation) or condition (e.g. EGF or heregulin stimulation) under examination and that this context dependence is informative with respect to mechanisms of signal propagation. Modeling predicts log-linear amplification so that significant ERK and Akt activation is observed at ligand concentrations far below the K(d) for receptor binding. However, MAPK and Akt modules isolated from the ErbB model continue to exhibit switch-like responses. Thus, key system-wide features of ErbB signaling arise from nonlinear interaction among signaling elements, the properties of which appear quite different in context and in isolation.
Conflict of interest statement
The authors declare that they have no conflict of interest.
Figures
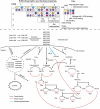
Figure 1
Simplified schematic representation of the ErbB model. Receptor interaction, internalization, recycling and activation of MAPK and PI3K/Akt pathways are shown. Phosphatase, Ras-GTP hydrolysis and feedback regulation are indicated by red arrows. Matrix shows properties of each receptor dimer relevant to the topology of the model; see Figure 1 in Supplementary information for further information. The prefix C on certain proteins denotes an abbreviated representation of multiple species in the model, e.g. C:Shc is composed of all receptor-bound Shc molecules, which may include ErbB1/1-Shc, ErbB1/2-Shc and so on. However, each of these Shc complexes is represented explicitly by one or more dynamic variables in the model.
Figure 2
Experimental and simulated dynamics for three cell lines, each treated with two concentrations of EGF and HRG. Twenty good fits are shown for each cell line. (A) A431, (B) H1666 and (C) H3255 were stimulated with 5 nM or 0.01 nM EGF or 5 nM or 1 nM HRG as indicated. Vertical axes denote normalized signals representing the phosphorylated (and nominally active) forms of ErbB1, ERK and Akt such that the highest measured and simulated value for one signal, across all treatment conditions, was set to 100. In each panel, the fit having the lowest value of the objective function is indicated by a bold line; slightly less good fits are indicated by faded lines. Experimental data are indicated by dots and standard error of the mean (biological triplicates) by the vertical bars. (D) Distributions of 8 parameter values across 50 independent parameter optimization runs; parameter identities are described in more detail in Supplementary information.
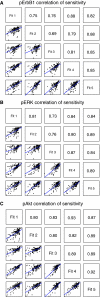
Figure 3
Correlation of sensitivities between five best A431 fits that have been optimized for parameters by simulated annealing. Panels give time-integrated sensitivities for (A) pErbB1, (B) pERK and (C) pAkt dynamics. Within each panel, small boxes in the lower triangle show the correlation plot for parameters sensitivities between two fits; upper triangle shows correlation value (R) associated with each correlation plot.
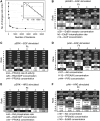
Figure 4
Regional sensitivity analysis. Regional sensitivities were calculated according to equation (3). (A) Changes in sensitivity rankings as a function of number of randomization iterations used in sampling for regional sensitivity. Changes in rankings were calculated relative to the rankings of the run with the next smallest number of iterations. (Inset) Power-law relationship between rank changes and increasing sample size on a log-linear scale with an exponent of 0.4. (B–F) Regional sensitivities of five fits to A431 data, showing the top 10 sensitive parameters for pErbB1 (B), pERK (C, E) and pAkt (D, F) dynamics integrated over time following stimulation with 5 nM EGF (B–D), or HRG (E, F). Shading of entries is as follows: black—parameters with a rank order in the top 10 across all five fits; dark grey—in top 10 across four fits; light grey—in top 10 across three fits.
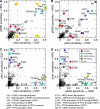
Figure 5
Dependency of parametric sensitivity on model feature or condition. Sensitivities were calculated according to equation (1). (A–D) Correlation plots comparing two dynamic variables (model features) or ligands (conditions). Vertical and horizontal dotted lines divide the plots into four quadrants (as labeled in red on a yellow background): I—insensitive parameters; II–III—parameters exhibiting differential sensitivities; IV—parameters along the diagonal showing joint sensitivities. Colors depict the biological activity or part of the pathway to which a parameter belongs as follows: red—receptor; blue—phosphatase; green—MAP kinase cascade; purple—PI3K–Akt cascade; yellow—Ras and its regulators. (A) pERK sensitivities compared for stimulation with 5 nM EGF versus HRG stimulation and (B) pAkt sensitivities under the same conditions. pERK versus pAkt sensitivities compared under 5 nM EGF (C) or HRG (D).
Figure 6
Differential sensitivity of pERK and pAkt to gefitnib treatment (A) and lapatinib treatment (B). Experimentally measured pERK (red diamonds and lines) and pAkt (black squares and lines) 5 min after EGF stimulation in A431 cells treated with inhibitor 10 min prior to ligand addition. Error bars indicate standard error of the mean.
Figure 7
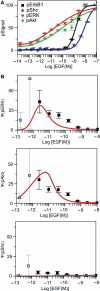
(A) Dose–response of pErbB1, pShc, pERK and pAkt (5 min after ligand addition) over a 106 range of EGF concentrations in A431 cells. (B) Amplification Ψ of signal calculated with equation (5) (5 min after ligand addition) over a 106 range of EGF concentrations in A431 cells for pERK, pAkt and pShc. Points represent data and lines represent simulation; error bars denote standard error of the mean. Gray boxes show high error measurements at low EGF concentrations, which arise due to phospho-ErbB1 signals being at the limit of detection.
Figure 8
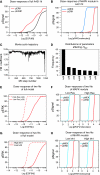
(A) Dose–response of pERK (red line) and pErbB1 (black line) computed with best IERMv1.0 fit to A431 data. (B) pERK (red line) and pMEK (blue line) responses in a MAPK module isolated from IERMv1.0. (C) Apparent Hill coefficient _H_app (as defined using equation (4) in text) of pERK during Monte Carlo sampling of parameters. (D) Parameters controlling apparent Hill coefficient: c44—Raf phosphatase abundance; k48—phosphatase binding to MEK; c41—Raf abundance; kd49—phosphatase catalysis of MEK; c53—MEK phosphatase abundance; c26––Ras abundance; k44––Raf binding to MEK. (E) Dose–response of pERK for an IERMv1.0 fit with high Ras (parameter c26) abundance (dotted line) or low Ras (solid line). (F) Dose–response of pMEK (blue line) and pERK (red line) in a MAPK module isolated from a IERMv1.0 fit having low values of parameter c26 (left panel) or high values (right panel). (G) Dose–response of pERK for an IERMv1.0 fit with high k44 (dotted line) or low k44 (solid line). (H) Dose–response of pMEK (blue line) and pERK (red line) in a MAPK module isolated from an IERMv1.0 fit having low values of k44 (left panel) or high values (right panel).
Figure 9
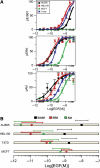
(A) Experimentally determined dose–response of pErbB1 (upper panel), pERK (central panel) and pAkt (lower panel) at _t_=5 min across a range of EGF concentrations in multiple cancer cell lines. Hill coefficients for each EC50 as calculated by nonlinear regression are given in the legend. (B) EC10—effective concentration at 10% of maximum—of three signals for each cell line. Boxes indicate the position of the EC10. Data points and fits to a Hill curve (lines) are colored as follows: black—AU565; red—HBL100; green—MCF7; blue—T47D. The levels of pErbB1 in MCF7 were below the level of detection, but activation of ERK and Akt signals in response to EGF treatment was easily measured. Hill coefficients as calculated by nonlinear regression for activation of pErbB1, pERK and pAkt are, respectively, in AU565 cells, 1.36, 0.82 and 0.58; HBL100 cells, 1.20, 0.89 and 0.88; T47D cells, 1.18, 1.61 and 1.02. For MCF7 cells, Hill coefficients for activation of pERK and pAkt were, respectively, 1.53 and 1.03. (B) EC10—effective concentration for 10% maximal activation for three phospho-signals in each cell line (box). Colored lines above boxes indicate the width of the corresponding activation profile of the Hill curve, defined as the concentration range that spans a rise in activation from 10 to 90%.
Similar articles
- HER2+ Cancer Cell Dependence on PI3K vs. MAPK Signaling Axes Is Determined by Expression of EGFR, ERBB3 and CDKN1B.
Kirouac DC, Du J, Lahdenranta J, Onsum MD, Nielsen UB, Schoeberl B, McDonagh CF. Kirouac DC, et al. PLoS Comput Biol. 2016 Apr 1;12(4):e1004827. doi: 10.1371/journal.pcbi.1004827. eCollection 2016 Apr. PLoS Comput Biol. 2016. PMID: 27035903 Free PMC article. - Negative constraints underlie the ErbB specificity of epidermal growth factor-like ligands.
van der Woning SP, van Rotterdam W, Nabuurs SB, Venselaar H, Jacobs-Oomen S, Wingens M, Vriend G, Stortelers C, van Zoelen EJ. van der Woning SP, et al. J Biol Chem. 2006 Dec 29;281(52):40033-40. doi: 10.1074/jbc.M603168200. Epub 2006 Oct 10. J Biol Chem. 2006. PMID: 17032651 - Stress and radiation-induced activation of multiple intracellular signaling pathways.
Dent P, Yacoub A, Contessa J, Caron R, Amorino G, Valerie K, Hagan MP, Grant S, Schmidt-Ullrich R. Dent P, et al. Radiat Res. 2003 Mar;159(3):283-300. doi: 10.1667/0033-7587(2003)159[0283:sariao]2.0.co;2. Radiat Res. 2003. PMID: 12600231 Review. - PI3K and Erk MAPK mediate ErbB signaling in Xenopus gastrulation.
Nie S, Chang C. Nie S, et al. Mech Dev. 2007 Sep-Oct;124(9-10):657-67. doi: 10.1016/j.mod.2007.07.005. Epub 2007 Jul 19. Mech Dev. 2007. PMID: 17716876 Free PMC article. - Targeting ErbB receptors in high-grade glioma.
Berezowska S, Schlegel J. Berezowska S, et al. Curr Pharm Des. 2011;17(23):2468-87. doi: 10.2174/138161211797249233. Curr Pharm Des. 2011. PMID: 21827413 Review.
Cited by
- Integrated experimental and model-based analysis reveals the spatial aspects of EGFR activation dynamics.
Shankaran H, Zhang Y, Chrisler WB, Ewald JA, Wiley HS, Resat H. Shankaran H, et al. Mol Biosyst. 2012 Nov;8(11):2868-82. doi: 10.1039/c2mb25190f. Epub 2012 Sep 5. Mol Biosyst. 2012. PMID: 22952062 Free PMC article. - Bioinformatics and systems biology.
Ram PT, Mendelsohn J, Mills GB. Ram PT, et al. Mol Oncol. 2012 Apr;6(2):147-54. doi: 10.1016/j.molonc.2012.01.008. Epub 2012 Feb 17. Mol Oncol. 2012. PMID: 22377422 Free PMC article. Review. - Computational Model of Gab1/2-Dependent VEGFR2 Pathway to Akt Activation.
Tan WH, Popel AS, Mac Gabhann F. Tan WH, et al. PLoS One. 2013 Jun 21;8(6):e67438. doi: 10.1371/journal.pone.0067438. Print 2013. PLoS One. 2013. PMID: 23805312 Free PMC article. - Quantitative analysis reveals how EGFR activation and downregulation are coupled in normal but not in cancer cells.
Capuani F, Conte A, Argenzio E, Marchetti L, Priami C, Polo S, Di Fiore PP, Sigismund S, Ciliberto A. Capuani F, et al. Nat Commun. 2015 Aug 12;6:7999. doi: 10.1038/ncomms8999. Nat Commun. 2015. PMID: 26264748 Free PMC article. - IBC's 22nd Annual Antibody Engineering and 9th Annual Antibody Therapeutics International Conferences and the 2011 Annual Meeting of The Antibody Society, December 5-8, 2011, San Diego, CA.
Nilvebrant J, Dunlop DC, Sircar A, Wurch T, Falkowska E, Reichert JM, Helguera G, Piccione EC, Brack S, Berger S. Nilvebrant J, et al. MAbs. 2012 Mar-Apr;4(2):153-81. doi: 10.4161/mabs.4.2.19495. Epub 2012 Mar 1. MAbs. 2012. PMID: 22453091 Free PMC article.
References
- Aldridge BB, Burke JM, Lauffenburger DA, Sorger PK (2006) Physicochemical modelling of cell signalling pathways. Nat Cell Biol 8: 1195–1203 - PubMed
- Amit I, Citri A, Shay T, Lu Y, Katz M, Zhang F, Tarcic G, Siwak D, Lahad J, Jacob-Hirsch J, Amariglio N, Vaisman N, Segal E, Rechavi G, Alon U, Mills GB, Domany E, Yarden Y (2007) A module of negative feedback regulators defines growth factor signaling. Nat Genet 39: 503–512 - PubMed
- Berkers JA, van Bergen en Henegouwen PM, Boonstra J (1991) Three classes of epidermal growth factor receptors on HeLa cells. J Biol Chem 266: 922–927 - PubMed
Publication types
MeSH terms
Substances
LinkOut - more resources
Full Text Sources
Research Materials
Miscellaneous
