Analysis of endocrine disruption in Southern California coastal fish using an aquatic multispecies microarray - PubMed (original) (raw)
. 2009 Feb;117(2):223-30.
doi: 10.1289/ehp.11627. Epub 2008 Aug 28.
Barbara Ruggeri, L James Sprague, Colleen Eckhardt-Ludka, Jennifer Lapira, Ivan Wick, Laura Soverchia, Massimo Ubaldi, Alberta Maria Polzonetti-Magni, Doris Vidal-Dorsch, Steven Bay, Joseph R Gully, Jesus A Reyes, Kevin M Kelley, Daniel Schlenk, Ellen C Breen, Roman Sásik, Gary Hardiman
Affiliations
- PMID: 19270792
- PMCID: PMC2649224
- DOI: 10.1289/ehp.11627
Analysis of endocrine disruption in Southern California coastal fish using an aquatic multispecies microarray
Michael E Baker et al. Environ Health Perspect. 2009 Feb.
Abstract
Background: Endocrine disruptors include plasticizers, pesticides, detergents, and pharmaceuticals. Turbot and other flatfish are used to characterize the presence of chemicals in the marine environment. Unfortunately, there are relatively few genes of turbot and other flatfish in GenBank, which limits the use of molecular tools such as microarrays and quantitative reverse-transcriptase polymerase chain reaction (qRT-PCR) to study disruption of endocrine responses in sentinel fish captured by regulatory agencies.
Objectives: We fabricated a multigene cross-species microarray as a diagnostic tool to screen the effects of environmental chemicals in fish, for which there is minimal genomic information. The array included genes that are involved in the actions of adrenal and sex steroids, thyroid hormone, and xenobiotic responses. This microarray will provide a sensitive tool for screening for the presence of chemicals with adverse effects on endocrine responses in coastal fish species.
Methods: We used a custom multispecies microarray to study gene expression in wild hornyhead turbot (Pleuronichthys verticalis) collected from polluted and clean coastal waters and in laboratory male zebrafish (Danio rerio) after exposure to estradiol and 4-nonylphenol. We measured gene-specific expression in turbot liver by qRT-PCR and correlated it to microarray data.
Results: Microarray and qRT-PCR analyses of livers from turbot collected from polluted areas revealed altered gene expression profiles compared with those from nonaffected areas.
Conclusions: The agreement between the array data and qRT-PCR analyses validates this multispecies microarray. The microarray measurement of gene expression in zebrafish, which are phylogenetically distant from turbot, indicates that this multispecies microarray will be useful for measuring endocrine responses in other fish.
Keywords: Danio rerio; Pleuronichthys verticalis; endocrine disruptors; flatfish; hornyhead turbot; microarray; multispecies array; nonylphenol; xenobiotics; xenoestrogens; zebrafish.
Figures
Figure 1
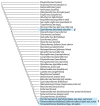
Flatfish (Pleuronectiformes) in an evolutionary context. Adapted from the phylogeny (Coleman 2004; Helfman et al. 1997). Tetraodontiformes (Fugu, Tetraodon) and Perciformes (cichlid, tilapia, sea bass, sea bream, perch) are close phylogenetic relatives of Pleuronectiformes (turbot, halibut, sole) (box 1). Cypriniformes (zebrafish) are distant phylogenetic relatives (box 2).
Figure 2
Schematic representation of the design and application of a multispecies microarray-based test to monitor xenoestrogen exposure for environmental monitoring.
Figure 3
MA plots of differential expression and signal intensity measurements using the multispecies endocrine microarray for control and exposed fish (loess normalization). (A–D) Individual LACSD-exposed fish versus pooled controls. (E–G) Individual OCSD-exposed fish versus pooled controls. (H) Pooled controls versus pooled controls. (I–K) Individual control fish versus pooled control. Each point represents data from a single 65mer oligonucleotide probe. M is a measure of differential gene expression [log2 (exposed /control)] in A–G or absence of significant differential gene expression in the self–self plots [log2 (control/control intensity)] in H_–_K. A is a measure of signal intensity [(0.5 log2 exposed intensity + 0.5 log2 control intensity) in A–G or (0.5 log2 control intensity + 0.5 log2 control intensity) in _H–K_].
Figure 4
Normal q-q plots of multispecies endocrine microarray data. The q-q plots were constructed to determine whether control and exposed fish data sets derived from populations have a common distribution. (A–D) Individual LACSD-exposed fish versus pooled controls. (E–G) Individual OCSD-exposed fish versus pooled controls. (H) Pooled controls versus pooled controls. (I–K) individual control fish versus pooled control. The q-q plots show the distribution of the log2 (exposed/control) fold changes and the deviation, if any, from a normal Gaussian distribution. When the two data sets derive from a population with the same distribution, the points fall approximately along this straight line, as is the case with the control sample data populations, both pooled and individual (I–K). When the two data sets derive from populations with different distributions, the data deviate from this straight line (A–G). Exposed samples differ from the control, with a sharp rise observed in the quantile curve at log2 ratios of 2, indicating the presence of large log2 ratios and true differences in gene expression.
Figure 5
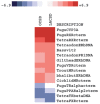
Gene expression profiling of male turbot liver collected at OCSD and LACSD (contaminated) and control fish from a nonaffected area. This heat map depicts fold changes observed between exposed and control fish. LACSD and OCSD data derived from four and three independent biologic replicate microarray experiments, respectively.
Figure 6
Multispecies SYBR Green qRT-PCR validation of multispecies endocrine microarray for Vtg1 (A), Vtg2( B), thyroid hormone receptor β (C), and _CYP3A_-specific transcripts (D) in livers from control (Con) and exposed (Exp) hornyhead turbot (each bar represents one fish). 18S rRNA served as an internal control for normalization. Plots are mean fold changes from triplicate measurements, relative to control fish. Vtg1 (A) and Vtg2 (B) transcripts were strongly up-regulated (> 15 fold) in one exposed fish. TRβ was down-regulated in two control fish. CYP3A was up-regulated in three fish and down-regulated in one fish.
Figure 7
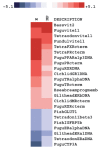
Cross-species applicability of the Multispecies endocrine microarray: detection of alterations in gene expression in zebrafish liver after a 2-week exposure to either 4-nonylphenol or estradiol. This heat map depicts fold changes between exposed and control fish. Data derived from four independent biological replicate experiments.
Similar articles
- Molecular analysis of endocrine disruption in hornyhead turbot at wastewater outfalls in southern california using a second generation multi-species microarray.
Baker ME, Vidal-Dorsch DE, Ribecco C, Sprague LJ, Angert M, Lekmine N, Ludka C, Martella A, Ricciardelli E, Bay SM, Gully JR, Kelley KM, Schlenk D, Carnevali O, Šášik R, Hardiman G. Baker ME, et al. PLoS One. 2013 Sep 25;8(9):e75553. doi: 10.1371/journal.pone.0075553. eCollection 2013. PLoS One. 2013. PMID: 24086568 Free PMC article. - Trophic transfer and effects of DDT in male hornyhead turbot (Pleuronichthys verticalis) from Palos Verdes Superfund site, CA (USA) and comparisons to field monitoring.
Crago J, Xu EG, Kupsco A, Jia F, Mehinto AC, Lao W, Maruya KA, Gan J, Schlenk D. Crago J, et al. Environ Pollut. 2016 Jun;213:940-948. doi: 10.1016/j.envpol.2016.03.060. Epub 2016 Apr 3. Environ Pollut. 2016. PMID: 27049791 Free PMC article. - Annual and seasonal evaluation of reproductive status in hornyhead turbot at municipal wastewater outfalls in the Southern California Bight.
Forsgren KL, Bay SM, Vidal-Dorsch DE, Deng X, Lu G, Armstrong J, Gully JR, Schlenk D. Forsgren KL, et al. Environ Toxicol Chem. 2012 Dec;31(12):2701-10. doi: 10.1002/etc.2006. Epub 2012 Oct 10. Environ Toxicol Chem. 2012. PMID: 22987602 - Molecular markers of endocrine disruption in aquatic organisms.
Rotchell JM, Ostrander GK. Rotchell JM, et al. J Toxicol Environ Health B Crit Rev. 2003 Sep-Oct;6(5):453-96. doi: 10.1080/10937400306476. J Toxicol Environ Health B Crit Rev. 2003. PMID: 12888444 Review. - Genomic resources for flatfish research and their applications.
Cerdà J, Douglas S, Reith M. Cerdà J, et al. J Fish Biol. 2010 Oct;77(5):1045-70. doi: 10.1111/j.1095-8649.2010.02695.x. J Fish Biol. 2010. PMID: 21039490 Review.
Cited by
- Towards a system level understanding of non-model organisms sampled from the environment: a network biology approach.
Williams TD, Turan N, Diab AM, Wu H, Mackenzie C, Bartie KL, Hrydziuszko O, Lyons BP, Stentiford GD, Herbert JM, Abraham JK, Katsiadaki I, Leaver MJ, Taggart JB, George SG, Viant MR, Chipman KJ, Falciani F. Williams TD, et al. PLoS Comput Biol. 2011 Aug;7(8):e1002126. doi: 10.1371/journal.pcbi.1002126. Epub 2011 Aug 25. PLoS Comput Biol. 2011. PMID: 21901081 Free PMC article. - Developmental and extracellular matrix-remodeling processes in rosiglitazone-exposed neonatal rat cardiomyocytes.
Paolini P, Pick D, Lapira J, Sannino G, Pasqualini L, Ludka C, Sprague LJ, Zhang X, Bartolotta EA, Vazquez-Hidalgo E, Barba DT, Bazan C, Hardiman G. Paolini P, et al. Pharmacogenomics. 2014 Apr;15(6):759-74. doi: 10.2217/pgs.14.39. Pharmacogenomics. 2014. PMID: 24897284 Free PMC article. - Current perspectives on the use of alternative species in human health and ecological hazard assessments.
Perkins EJ, Ankley GT, Crofton KM, Garcia-Reyero N, LaLone CA, Johnson MS, Tietge JE, Villeneuve DL. Perkins EJ, et al. Environ Health Perspect. 2013 Sep;121(9):1002-10. doi: 10.1289/ehp.1306638. Epub 2013 Jun 14. Environ Health Perspect. 2013. PMID: 23771518 Free PMC article. Review. - Two high-throughput screening assays for aberrant RNA-protein interactions in myotonic dystrophy type 1.
Chen CZ, Sobczak K, Hoskins J, Southall N, Marugan JJ, Zheng W, Thornton CA, Austin CP. Chen CZ, et al. Anal Bioanal Chem. 2012 Feb;402(5):1889-98. doi: 10.1007/s00216-011-5604-0. Epub 2012 Jan 5. Anal Bioanal Chem. 2012. PMID: 22218462 Free PMC article. - Systems Analysis of the Liver Transcriptome in Adult Male Zebrafish Exposed to the Plasticizer (2-Ethylhexyl) Phthalate (DEHP).
Huff M, da Silveira WA, Carnevali O, Renaud L, Hardiman G. Huff M, et al. Sci Rep. 2018 Feb 1;8(1):2118. doi: 10.1038/s41598-018-20266-8. Sci Rep. 2018. PMID: 29391432 Free PMC article.
References
- Ahel M, Conrad J, Giger W. Persistent organic chemicals in sewage effluents. 3. Determinations of nonylphenoxy carboxylic acids by high-resolution gas chromatography/mass spectrometry and high-performance liquid chromatography. Environ Sci Technol. 1987;21:697–703. - PubMed
- Altschul SF, Gish W, Miller W, Myers EW, Lipman DJ. Basic local alignment search tool. J Mol Biol. 1990;215:403–410. - PubMed
- Baker ME. Adrenal and sex steroid receptor evolution: environmental implications. J Mol Endocrinol. 2001;26:119–125. - PubMed
- Baker ME. Evolutionary analysis of 11beta-hydroxysteroid dehydrogenase-type 1, -type 2, -type 3 and 17beta-hydroxy-steroid dehydrogenase-type 2 in fish. FEBS Lett. 2004;574:167–170. - PubMed


