The homeostasis of Plasmodium falciparum-infected red blood cells - PubMed (original) (raw)
The homeostasis of Plasmodium falciparum-infected red blood cells
Jakob M A Mauritz et al. PLoS Comput Biol. 2009 Apr.
Abstract
The asexual reproduction cycle of Plasmodium falciparum, the parasite responsible for severe malaria, occurs within red blood cells. A merozoite invades a red cell in the circulation, develops and multiplies, and after about 48 hours ruptures the host cell, releasing 15-32 merozoites ready to invade new red blood cells. During this cycle, the parasite increases the host cell permeability so much that when similar permeabilization was simulated on uninfected red cells, lysis occurred before approximately 48 h. So how could infected cells, with a growing parasite inside, prevent lysis before the parasite has completed its developmental cycle? A mathematical model of the homeostasis of infected red cells suggested that it is the wasteful consumption of host cell hemoglobin that prevents early lysis by the progressive reduction in the colloid-osmotic pressure within the host (the colloid-osmotic hypothesis). However, two critical model predictions, that infected cells would swell to near prelytic sphericity and that the hemoglobin concentration would become progressively reduced, remained controversial. In this paper, we are able for the first time to correlate model predictions with recent experimental data in the literature and explore the fine details of the homeostasis of infected red blood cells during five model-defined periods of parasite development. The conclusions suggest that infected red cells do reach proximity to lytic rupture regardless of their actual volume, thus requiring a progressive reduction in their hemoglobin concentration to prevent premature lysis.
Conflict of interest statement
The authors have declared that no competing interests exist.
Figures
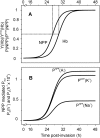
Figure 1. NPP development and Hb consumption as a function of time post-invasion.
(A) Normalized time-course of NPP development and of Hb consumption as originally encoded in the model , represented as fraction of maximal NPP permeability (PNPP/Pmax NPP) and maximal digested Hb (YHb/Ymax Hb), respectively (see equations S21 and 22 in Text S1). The half-time and slope values for the NPP and Hb curves shown here were (in h) 27-2 and 30-2, respectively. (B) cation and anion permeabilities through NPPs as a function of time. Note the difference of three orders of magnitude between cation and anion permeabilities.
Figure 2. Predicted changes in selected model variables as a function of time post-invasion.
The parameter values chosen for this simulation were: coupling factor, 1.0; maximal fraction of Hb consumed, 0.7; half times and slope values for NPP development and Hb consumption curves as in Figure 1 (in h, 27-2 and 30-2). (A) volumes of parasite, host cell water, host RBC and IRBC, relative to IRBC volume at t = 0. (B) Na+, K+ and diffusible anion content of IRBCs, in mmol (1013 cells)−1 (1013 cells is taken to represent the approximate volume of a litre of normal, uninfected packed red blood cells with a mean cell volume of 100 fl). (C) Na+, K+ and diffusible anion concentration in host cell water, in mM. (D) Membrane potential (Em) and equilibrium potentials (Nernst potentials) of Na+ (ENa), K+ (EK), diffusible anion (EA) and protons (EH) across the host cell membrane. (E) Differences between EX (X = Na+ and K+ in mV, A− and H+ in mV 10−2) and Em (ΔEX = EX−Em), representing the changing driving forces for passive ion fluxes across the host cell membrane throughout the asexual reproduction cycle, in mV. (F) Net water flux across the host cell membrane, in l(1013 cells)−1(h)−1.
Figure 3. Predicted changes in additional model variables as a function of time post-invasion.
(A) Net fluxes of Na+, K+, A− and H+ across the host cell membrane, in mmol(1013 cells)−1(h)−1. (B) Changes in host cell Hb content, in mmol(1013 cells)−1, and in Hb concentration within host cell water phase, in mM. (C) pH of host cytosol. (D) Na pump-mediated fluxes of Na+ and K+, in mmol(1013 cells)−1(h)−1.
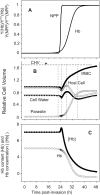
Figure 4. Time dependent effects of all-or-none NPP activation on selected model variables.
(A) Normalized curves representing the time-course of NPP development and of Hb consumption applied in this simulation. The half-time and slope values for the NPP and Hb curves shown here were (in h) 24-0.2 and 32-2, respectively. (B and C) As for Figures 2A and 3B respectively. Following Ponder , the critical hemolytic volume shown was set at 1.7 times the relative cell volume.
Figure 5. Effect of coupling factor on the magnitude of parasite volume-growth.
The time-course of parasite volume growth was linked to the ingestion of host cytosol. The volume of cytosol incorporated into the parasite at each instant of time is determined by the need to provide the right amount of Hb, as prescribed by the Hb consumption function (equation S22 in Text S1). The coupling factor defines the fraction by which the cumulative cytostomal ingestions convert to parasite volumes (equation S28 in Text S1). With a coupling factor of 1, parasite volume growth reflects the cumulative sum of all cytostomal ingestions. It can be seen that with a maximal Hb consumption set at 70% in the present simulation, parasite volume nears 80% of the original host cell volume. In the curves shown here the coupling factor was varied from 0.3 to 1.0 in steps of 0.1. All other parameters are as in Figures 2 and 3.
Figure 6. Effect of parameter variation on predicted changes as a function of time post-invasion.
The parameters varied and the range of values reported in the 48 curves of this figure are as follows: coupling factor (cf), 0.3, 0.5, 0.7 and 1; paired half-times of NPP development and Hb consumption (in h), 22–26, 27–32, and 32–38; slope-parameter of NPP and Hb curves (in h), 2 and 3; maximal Hb consumption (fraction of total initial Hb), 0.7 and 0.8. (A): host cell water volume, relative to initial IRBC volume; (B): IRBC volume, relative to initial volume. The broken line represents the nominal CHV based on a mean value of 1.7 reported for normal uninfected RBCs ; (C): relative parasite volume; (D): host cell Hb content, in mmol(1013 cells)−1; (E): Hb concentration in host cell water, mM. Overlapping curves in Panels A, D and E conceal all the 48 curves within the 12 that can be discerned.
Figure 7. Comparison between predicted and measured variable values.
Measured values were obtained from the references listed. The ranges of predicted variable values shown in Figure 6 are redrawn as grey silhouettes; the experimental data is plotted as boxes. On the ordinate the box indicates the reported statistical errors; on the time axis the box width is arbitrarily set to 26–34 h for trophozoites, 36–46 h for schizonts, and 42–48 h for segmentors using the period assignations in the original papers. Data for uninfected cells is shown at time = 0, where available. Symbols indicate the source of the data, as follows: closed circles – Park et al. ; open and closed triangles – Elliott et al. ,; open diamonds – Krugliak et al. ; open stars – Zanner et al. ; open squares – Saliba et al. ; closed diamonds – Esposito et al. . (A) Host cell water volume, relative to initial IRBC volume; (B) IRBC volume, relative to initial volume; (C) relative parasite volume; (D) host cell Hb content, in mmol(1013 cells)−1; (E) Hb concentration in host cell water, mM. Data in (B) and (E) were modified from the original references to fit the units used in the model (E) or to provide plausible estimates in the absence of direct measurements (B). IRBC volumes in (B) (dotted lines) were estimated from data in Park et al. and Elliot et al. by adding the cytosol volume from Park et al. to the parasite volume from Elliot et al. . [Hb] data in Panel E, from Park et al. , was obtained by dividing the Hb content of the cytosol by the water content of the cytosol after subtracting the volume occupied by the Hb molecules. The data was then normalized to the initial value of [Hb] used for the model simulations.
Similar articles
- FRET imaging of hemoglobin concentration in Plasmodium falciparum-infected red cells.
Esposito A, Tiffert T, Mauritz JM, Schlachter S, Bannister LH, Kaminski CF, Lew VL. Esposito A, et al. PLoS One. 2008;3(11):e3780. doi: 10.1371/journal.pone.0003780. Epub 2008 Nov 21. PLoS One. 2008. PMID: 19023444 Free PMC article. - Excess hemoglobin digestion and the osmotic stability of Plasmodium falciparum-infected red blood cells.
Lew VL, Tiffert T, Ginsburg H. Lew VL, et al. Blood. 2003 May 15;101(10):4189-94. doi: 10.1182/blood-2002-08-2654. Epub 2003 Jan 16. Blood. 2003. PMID: 12531811 - Excess haemoglobin digestion by malaria parasites: a strategy to prevent premature host cell lysis.
Lew VL, Macdonald L, Ginsburg H, Krugliak M, Tiffert T. Lew VL, et al. Blood Cells Mol Dis. 2004 May-Jun;32(3):353-9. doi: 10.1016/j.bcmd.2004.01.006. Blood Cells Mol Dis. 2004. PMID: 15121091 - Cytoadherence, pathogenesis and the infected red cell surface in Plasmodium falciparum.
Newbold C, Craig A, Kyes S, Rowe A, Fernandez-Reyes D, Fagan T. Newbold C, et al. Int J Parasitol. 1999 Jun;29(6):927-37. doi: 10.1016/s0020-7519(99)00049-1. Int J Parasitol. 1999. PMID: 10480730 Review. - Ion metabolism in malaria-infected erythrocytes.
Tanabe K. Tanabe K. Blood Cells. 1990;16(2-3):437-49. Blood Cells. 1990. PMID: 2175223 Review.
Cited by
- An automated live imaging platform for studying merozoite egress-invasion in malaria cultures.
Crick AJ, Tiffert T, Shah SM, Kotar J, Lew VL, Cicuta P. Crick AJ, et al. Biophys J. 2013 Mar 5;104(5):997-1005. doi: 10.1016/j.bpj.2013.01.018. Biophys J. 2013. PMID: 23473482 Free PMC article. - Progeny counter mechanism in malaria parasites is linked to extracellular resources.
Stürmer VS, Stopper S, Binder P, Klemmer A, Lichti NP, Becker NB, Guizetti J. Stürmer VS, et al. PLoS Pathog. 2023 Dec 5;19(12):e1011807. doi: 10.1371/journal.ppat.1011807. eCollection 2023 Dec. PLoS Pathog. 2023. PMID: 38051755 Free PMC article. - Malaria parasite mutants with altered erythrocyte permeability: a new drug resistance mechanism and important molecular tool.
Hill DA, Desai SA. Hill DA, et al. Future Microbiol. 2010 Jan;5(1):81-97. doi: 10.2217/fmb.09.109. Future Microbiol. 2010. PMID: 20020831 Free PMC article. Review. - Quantitative imaging of human red blood cells infected with Plasmodium falciparum.
Esposito A, Choimet JB, Skepper JN, Mauritz JM, Lew VL, Kaminski CF, Tiffert T. Esposito A, et al. Biophys J. 2010 Aug 4;99(3):953-60. doi: 10.1016/j.bpj.2010.04.065. Biophys J. 2010. PMID: 20682274 Free PMC article. - Haem-activated promiscuous targeting of artemisinin in Plasmodium falciparum.
Wang J, Zhang CJ, Chia WN, Loh CC, Li Z, Lee YM, He Y, Yuan LX, Lim TK, Liu M, Liew CX, Lee YQ, Zhang J, Lu N, Lim CT, Hua ZC, Liu B, Shen HM, Tan KS, Lin Q. Wang J, et al. Nat Commun. 2015 Dec 22;6:10111. doi: 10.1038/ncomms10111. Nat Commun. 2015. PMID: 26694030 Free PMC article.
References
- Ginsburg H, Stein WD. New permeability pathways induced by the malarial parasite in the membrane of its host erythrocyte: potential routes for targeting of drugs into infected cells. Biosci Rep. 1987;7:455–463. - PubMed
- Ginsburg H. How and why does the malarial parasite permeabilize its host cell membrane? In: Benga GH, Trager JM, editors. Biomembranes: Basic & Medical Research. Berlin: Springer-Verlag; 1988. pp. 188–203.
- Kanaani J, Ginsburg H. Compartment analysis of ATP in malaria-infected erythrocytes. Biochem Int. 1988;17:451–459. - PubMed
- Kanaani J, Ginsburg H. Metabolic interconnection between the human malarial parasite Plasmodium falciparum and its host erythrocyte. Regulation of ATP levels by means of an adenylate translocator and adenylate kinase. J Biol Chem. 1989;264:3194–3199. - PubMed
- Kanaani J, Ginsburg H. Transport of lactate in Plasmodium falciparum-infected human erythrocytes. J Cell Physiol. 1991;149:469–476. - PubMed
Publication types
MeSH terms
LinkOut - more resources
Full Text Sources


