Identification of the Zn2+ binding site and mode of operation of a mammalian Zn2+ transporter - PubMed (original) (raw)
Identification of the Zn2+ binding site and mode of operation of a mammalian Zn2+ transporter
Ehud Ohana et al. J Biol Chem. 2009.
Abstract
Vesicular zinc transporters (ZnTs) play a critical role in regulating Zn2+ homeostasis in various cellular compartments and are linked to major diseases ranging from Alzheimer disease to diabetes. Despite their importance, the intracellular localization of ZnTs poses a major challenge for establishing the mechanisms by which they function and the identity of their ion binding sites. Here, we combine fluorescence-based functional analysis and structural modeling aimed at elucidating these functional aspects. Expression of ZnT5 was followed by both accelerated removal of Zn2+ from the cytoplasm and its increased vesicular sequestration. Further, activity of this zinc transport was coupled to alkalinization of the trans-Golgi network. Finally, structural modeling of ZnT5, based on the x-ray structure of the bacterial metal transporter YiiP, identified four residues that can potentially form the zinc binding site on ZnT5. Consistent with this model, replacement of these residues, Asp599 and His451, with alanine was sufficient to block Zn2+ transport. These findings indicate, for the first time, that Zn2+ transport mediated by a mammalian ZnT is catalyzed by H+/Zn2+ exchange and identify the zinc binding site of ZnT proteins essential for zinc transport.
Figures
FIGURE 1.
Expression and intracellular distribution of ZnT5 and ZnT6. a, HEK293-T cells were transfected with hZnT5 or HA-tagged ZnT6 plasmids. Immunoblot analysis of cell lysates (50 μg) was performed using either anti-hZnT5 or anti-HA monoclonal antibodies, respectively. b, HEK293-T cells transfected with hZnT5 or HA-ZnT6 (labeled in red, lower left panel) were co-transfected with pHluorins (targeted to the TGN, labeled in green, shown in the upper left panel). Cells were imaged using a confocal microscope (magnification ×100). Colocalization of pHluorins and ZnT5 or ZnT6 is shown in the corresponding bottom right images by overlapping the images obtained with each stain with the bright field image (shown in the upper right panel).
FIGURE 2.
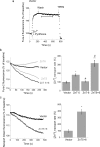
Enhanced cytoplasmic Zn2+ transport in cells co-expressing the ZnT proteins. a, experimental paradigm for monitoring cytoplasmic Zn2+ transport. HEK293-T cells, transfected with the indicated plasmids, were loaded with Fura-2. At the time indicated by an arrow, the cells were superfused with Ringer's solution containing 200 μ
m
Zn2+ and 2 μ
m
pyrithione, which was followed by a rise in intracellular Zn2+. Cells were then superfused with Ringer's solution without Zn2+ or pyrithione to remove the residual pyrithione from the membrane. Note that [Zn2+]i remained occluded within the cells. Cytoplasmic Zn2+ transport rates were monitored during the perfusion with the Zn2+- and pyrithione-free Ringer's solution for the time interval indicated by the bar. To ascertain that the signal is related to Zn2+, the membrane-permeable metal chelator, TPEN, was added to the superfusing solution at the end of the experiment (at the time indicated by the arrow). b, representative traces of Fura-2 signal normalized to initial fluorescence (_R_0), in cells expressing the indicated transporters. The time period marked by the bar in a was used for determining the rate of Zn2+ transport. The histogram shows averaged rates of cytoplasmic Zn2+ removal normalized to the rates of control cells (mean ± S.E., n = 10). c, cells preloaded with the intracellular Zn2+-specific dye, Newport Green, subjected to the same paradigm described in a, and representative traces of changes in intracellular Zn2+, from the time period indicated by the bar in a. Shown are averaged rates of cytoplasmic Zn2+ removal obtained from Newport Green-loaded cells (mean ± S.E., n = 8) (p value relative to control (*) or relative to ZnT5 (#); *, p < 0.05; **, p < 0.01).
FIGURE 3.
Vesicular Zn2+ accumulation within intracellular compartments is increased in cells expressing either ZnT5+6 or ZnT5 alone. a and b, cells expressing the indicated ZnTs were preloaded with Zn2+ and stained with Zinpyr-1, which preferably distributes into the Golgi network. Fluorescence intensity was determined in the presence or absence of the TPEN (20 μ
m
) (mean ± S.E., n = 3) (p value relative to control (*) or relative to ZnT5 (#); *, p < 0.05; **, p < 0.01).
FIGURE 4.
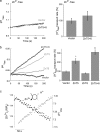
Inhibition of the V-type H+ ATPase blocks ZnT-mediated Zn2+ transport. a, rates of cytoplasmic Zn2+ efflux were determined in Fura-2-loaded cells expressing ZnT5, ZnT5+6, or vector alone. Cells were superfused with Zn2+ (5 μ
m
) and pyrithione (1 μ
m
) following the NH4Cl prepulse. The averaged rates of cytoplasmic Zn2+ transport, as in Fig. 2_b_, are shown in the histogram (mean ± S.E., n = 7). b, rates of cytoplasmic Zn2+ efflux in Fura-2-loaded cells expressing ZnT5+6 were determined in the presence or absence of the V-type ATPase inhibitor, bafilomycin (100 n
m
). The inset shows the effect of bafilomycin on the pH in the lumen of the Golgi in cells transfected with the pHluorin plasmid only. Averaged normalized rates are shown in the histogram (mean ± S.E., n = 5) (p value relative to control (*) or relative to ZnT5 (#); *, p < 0.05; **, p < 0.01).
FIGURE 5.
Zinc-dependent alkalinization of the Golgi in cells expressing ZnT proteins. a, cells co-expressing pHluorins, targeted to the TGN, and the indicated ZnTs were superfused with Zn2+-free Ringer's solution. Averaged normalized rates of vesicular pHluorin fluorescence change are shown at the right (mean ± S.E., n = 10). b, rates of vesicular pH in cells co-expressing either ZnT5+6, ZnT5 alone, or ZnT6 alone were determined by measuring the rate at the time period following Zn2+ loading. Averaged normalized rates are shown on the right (mean ± S.E., n = 8). c, representative traces of cytoplasmic Zn2+ imaged with Fura-2 (as in Fig. 2_a_) and vesicular pH imaged with pHluorins (as in b), following loading with Zn2+ (mean ± S.E., n = 7) are shown. Note the reciprocal change in Zn2+ and pH, indicating that the transport of these ions is coupled (p value relative to control (*) or relative to ZnT5 (#); *, p < 0.05; **, p < 0.01).
FIGURE 6.
Structural model of the Zn2+ binding site of ZnT5, based on its homology to the bacterial transporter, YiiP. a, ribbon representation of the ZnT5 model. The transmembrane helices 11 and 14 that coordinate the zinc ion (black) are colored yellow and magenta, respectively. The box indicates the Zn2+ binding site. Aspartic acid residues are colored red, and histidine residues are blue. b, comparison between the coordinating residues for the Zn2+ binding site on ZnT5 (top) and the bacterial transporter (bottom). In ZnT5, histidine 451 (marked by an arrow) replaces aspartic acid 45 of YiiP (colors as in a).
FIGURE 7.
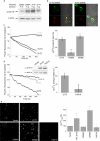
Functional analysis of ZnT5 mutants shows that aspartate 599 and histidine 451 are essential for Zn2+ transport. a, immunoblot analysis of HEK293-T lysates (50 μg) from cells transfected with 2 or 4 μg of WT ZnT5 and 4 μg of the ZnT5 D599A or ZnT5 D599E plasmids. The amounts of plasmids were set accordingly in Fig. 7, b and c, and cells were transfected with 2 μg of ZnT5 or ZnT5 D599A and 4 μg of ZnT5 D599E plasmids. b, confocal microscope images showing expression of the Asp599 mutants (red) co-expressed in HEK293-T cells with pHluorins (green). Note the overlap between the expression of the ZnT5 mutants and pHluorins, indicating that the mutants are also localized to TGN, similar to the expression of ZnT5 and ZnT6, shown in Fig. 1_b. c_, cytoplasmic Zn2+ removal rates determined as in Fig. 2_a_ in HEK293-T cells transfected with the D599A or D599E mutants or with WT ZnT5 and loaded with FluoZin-3. Rates of Zn2+ transport were determined as described in Fig. 2 and normalized against the rate of Zn2+ transport by WT ZnT5 (mean ± S.E., n = 8). d, cytoplasmic Zn2+ removal rate in cells expressing the ZnT5 H451A mutant or the WT ZnT5, as in c (mean ± S.E., n = 5). Inset, immunoblot analysis of ZnT5 H451A mutant expression in HEK293-T cells. Note that the expressions of the WT and the H451A mutant are similar. e, cells transfected with the indicated constructs loaded with Zinpyr-1 and analyzed for vesicular Zn2+, as described in the legend to Fig. 3 (mean ± S.E., n = 3) (*, p < 0.05, relative to control).
Similar articles
- A structural overview of the zinc transporters in the cation diffusion facilitator family.
Cotrim CA, Jarrott RJ, Martin JL, Drew D. Cotrim CA, et al. Acta Crystallogr D Struct Biol. 2019 Apr 1;75(Pt 4):357-367. doi: 10.1107/S2059798319003814. Epub 2019 Apr 5. Acta Crystallogr D Struct Biol. 2019. PMID: 30988253 Free PMC article. Review. - Histidine pairing at the metal transport site of mammalian ZnT transporters controls Zn2+ over Cd2+ selectivity.
Hoch E, Lin W, Chai J, Hershfinkel M, Fu D, Sekler I. Hoch E, et al. Proc Natl Acad Sci U S A. 2012 May 8;109(19):7202-7. doi: 10.1073/pnas.1200362109. Epub 2012 Apr 23. Proc Natl Acad Sci U S A. 2012. PMID: 22529353 Free PMC article. - ZnT2 is an electroneutral proton-coupled vesicular antiporter displaying an apparent stoichiometry of two protons per zinc ion.
Golan Y, Alhadeff R, Warshel A, Assaraf YG. Golan Y, et al. PLoS Comput Biol. 2019 Mar 20;15(3):e1006882. doi: 10.1371/journal.pcbi.1006882. eCollection 2019 Mar. PLoS Comput Biol. 2019. PMID: 30893306 Free PMC article. - Molecular architecture and function of ZnT transporters.
Kambe T. Kambe T. Curr Top Membr. 2012;69:199-220. doi: 10.1016/B978-0-12-394390-3.00008-2. Curr Top Membr. 2012. PMID: 23046652 Review. - Structural insights into human zinc transporter ZnT1 mediated Zn2+ efflux.
Long Y, Zhu Z, Zhou Z, Yang C, Chao Y, Wang Y, Zhou Q, Wang MW, Qu Q. Long Y, et al. EMBO Rep. 2024 Nov;25(11):5006-5025. doi: 10.1038/s44319-024-00287-3. Epub 2024 Oct 10. EMBO Rep. 2024. PMID: 39390258 Free PMC article.
Cited by
- A structural overview of the zinc transporters in the cation diffusion facilitator family.
Cotrim CA, Jarrott RJ, Martin JL, Drew D. Cotrim CA, et al. Acta Crystallogr D Struct Biol. 2019 Apr 1;75(Pt 4):357-367. doi: 10.1107/S2059798319003814. Epub 2019 Apr 5. Acta Crystallogr D Struct Biol. 2019. PMID: 30988253 Free PMC article. Review. - X-ray crystallography and isothermal titration calorimetry studies of the Salmonella zinc transporter ZntB.
Wan Q, Ahmad MF, Fairman J, Gorzelle B, de la Fuente M, Dealwis C, Maguire ME. Wan Q, et al. Structure. 2011 May 11;19(5):700-10. doi: 10.1016/j.str.2011.02.011. Structure. 2011. PMID: 21565704 Free PMC article. - SLC-30A9 is required for Zn2+ homeostasis, Zn2+ mobilization, and mitochondrial health.
Deng H, Qiao X, Xie T, Fu W, Li H, Zhao Y, Guo M, Feng Y, Chen L, Zhao Y, Miao L, Chen C, Shen K, Wang X. Deng H, et al. Proc Natl Acad Sci U S A. 2021 Aug 31;118(35):e2023909118. doi: 10.1073/pnas.2023909118. Proc Natl Acad Sci U S A. 2021. PMID: 34433664 Free PMC article. - Heterologous Expression and Biochemical Characterization of the Human Zinc Transporter 1 (ZnT1) and Its Soluble C-Terminal Domain.
Cotrim CA, Jarrott RJ, Whitten AE, Choudhury HG, Drew D, Martin JL. Cotrim CA, et al. Front Chem. 2021 Apr 30;9:667803. doi: 10.3389/fchem.2021.667803. eCollection 2021. Front Chem. 2021. PMID: 33996761 Free PMC article. - Redox regulation of intracellular zinc: molecular signaling in the life and death of neurons.
Aras MA, Aizenman E. Aras MA, et al. Antioxid Redox Signal. 2011 Oct 15;15(8):2249-63. doi: 10.1089/ars.2010.3607. Epub 2011 Mar 31. Antioxid Redox Signal. 2011. PMID: 20849376 Free PMC article. Review.
References
- Vallee B. L., Falchuk K. H. ( 1993) Physiol. Rev. 73, 79– 118 - PubMed
- Huang L., Gitschier J. ( 1997) Nat. Genet. 17, 292– 297 - PubMed
Publication types
MeSH terms
Substances
LinkOut - more resources
Full Text Sources
Other Literature Sources
Molecular Biology Databases


