Translocation of SenP5 from the nucleoli to the mitochondria modulates DRP1-dependent fission during mitosis - PubMed (original) (raw)
Translocation of SenP5 from the nucleoli to the mitochondria modulates DRP1-dependent fission during mitosis
Rodolfo Zunino et al. J Biol Chem. 2009.
Abstract
The mechanisms that ensure an equal inheritance of cellular organelles during mitosis are an important area of study in cell biology. For the mitochondria fragment during mitosis, however, the cellular links that signal these changes are largely unknown. We recently identified a SUMO protease, SenP5, that deSUMOylates a number of mitochondrial targets, including the dynamin-related fission GTPase, DRP1. In interphase, SenP5 resides primarily within the nucleoli, in addition to a cytosolic pool. Here we report the relocalization of SenP5 from the nucleoli to the mitochondrial surface at G2/M transition prior to nuclear envelope breakdown. The recruitment of SenP5 results in a significant loss in mitochondrial SUMOylation, and a concomitant increase in the labile pool of DRP1 that drives mitochondrial fragmentation. Importantly, silencing of SenP5 leads to an arrest in the cell cycle precisely at the time when the protease is translocated to the mitochondria. These data indicate that transition of SenP5 to the mitochondria plays an important role in mitochondrial fragmentation during mitosis. The altered intracellular localization of SenP5 represents the first example of the mitochondrial recruitment of a SUMO protease and provides new insights into the mechanisms of interorganellar communication during the cell cycle.
Figures
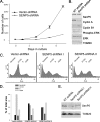
FIGURE 1.
Silencing of SenP5 leads to a cell cycle arrest at G2/M. A, COS-7 cells stably expressing non-targeted shRNA or SenP5 shRNA were cultured and cell numbers quantified. The graph plots the cell numbers obtained at 3, 5, and 7 days of culture. Results express the mean ± S.D. of two independent experiments. B, aliquots obtained at 7 days of the experiment in A were processed for electrophoresis and Western blots with the indicated antibodies. C, HeLa cells expressing vector-shRNA, SenP5-shRNA I, or SenP5-shRNA II were grown in 20 μg/ml puromycin for 3 days, harvested, stained with propidium iodide, and analyzed for DNA content by FACS. D, the peaks were quantified using Summit version 4.3 software and plotted, as indicated. E, an aliquot of the HeLa cells used for the FACS analysis were analyzed by Western blot to confirm the extent of SenP5 silencing using each hairpin.
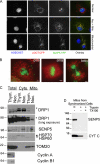
FIGURE 2.
SenP5 translocates to the mitochondrial membrane during the G2/M phase. A, COS-7 cells were transfected with OCT-CFP, SenP5-YFP, fixed, and stained with Hoechst, prior to analysis by fluorescence microscopy. B, mitotic cells at prophase, anaphase, and telophase, showing SenP5-YFP on the mitochondria (red). Chromatin distribution was revealed by Hoechst (green). Scale is 5 μm. C, COS-7 cells were synchronized with either a double thymidine block alone (G1/S), or the thymidine block followed by a 12-h release in 100 ng/ml nocodazole (G2/M). These cells were harvested, and total extracts, cytosolic and mitochondrial fractions were obtained. Then, 25 μg of protein from each fraction was loaded on the gel and processed for electrophoresis and Western analysis with antibodies against endogenous SenP5, DRP1, HSP60, TOM20, and HSP70, as shown. Cyclin A (G1/S) and cyclin B1 (G2/M) were probed as synchronization controls. Asterisks indicate the higher migrating form of DRP1 that is lost upon the delivery of SenP5 to the mitochondria in nocodazole-treated cells. D, COS-7 cells were synchronized with double thymidine block, followed by a 6-h release to enrich endogenous SenP5 on the mitochondria. Cells were harvested, mitochondria were isolated, and 20-μg aliquots were either left untreated (lane 1), or treated with 0.1 mg/ml trypsin in the presence or absence of 1% Triton X-100 (second and third lanes 2). Western blots were probed for endogenous SenP5, and cytochrome c as an internal control.
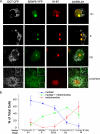
FIGURE 3.
Quantification of SenP5 recruitment to the mitochondria using multiple cell cycle markers. A, unsynchronized COS-7 cells were transfected with OCT-CFP and SenP5-YFP overnight. The cells were then fixed and stained with an antibody against the cell cycle marker KI-67. Representative fluorescence microscopy pictures at different stages of the cell cycle are shown. Insets show colocalization of SenP5-YFP and the mitochondrial marker OCT-CFP. Scale bar, 5 μm. B, quantification of SenP5-YFP distribution along the cell cycle. COS-7 cells were transfected with OCT-CFP and SenP5-YFP overnight, then stained with monoclonal antibodies against different markers of the cell cycle: anti-cyclin D1 and -2 for G1 phase, anti-BrdUrd for S phase, anti-cyclin A for S and G2 phases, anti-cyclin B1 (cytosolic) for the G2 phase, and nuclear cyclin B1 staining reflected the M phase. The distribution of SenP5-YFP was scored as nuclear, nuclear and mitochondrial, or mitochondrial, and determined as a percentage of total cells positive for both SenP5-YFP transfection and for the different cell cycle markers. Results express the mean ± S.D. of three independent experiments, with at least 50 cells examined in each case.
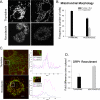
FIGURE 4.
Mitochondria fragment in mitosis and a more labile pool of DRP1 is enriched on the membranes. A, panels showing cells synchronized as indicated, fixed, and stained with anti-Tom20 antibodies. Scale bar, 10 μm. B, graph showing the mitochondrial phenotype in G1/S (thymidine) versus G2/M (nocodazole)-synchronized cells (results are mean ± S.D. of 3 coverslips examined in each case, with 50 cells examined per coverslip). C, COS-7 cells were synchronized as indicated, then fixed and stained with monoclonal anti-DRP1 (red) and polyclonal anti-Tom20 (green), for analysis by confocal fluorescence microscopy. Line scans were drawn across DRP1 puncta that localized with mitochondria, and those that were found within the cytosol. Examples of these foci are shown for each condition (inset) and the line scans are indicated. Scale bars, 5 μm. D, the relative intensity of endogenous DRP1 foci along the mitochondrial tubules relative to the background cytosolic signal were quantified using line scans in cells synchronized in G1/S (thymidine) and G2/M (nocodazole). The results are the mean ± S.D. of 10 cytosolic DRP1 line scans versus 10 mitochondrial DRP1 line scans per cell with n = 7 cells examined for both G1/S and G2/M phases.
FIGURE 5.
DRP1 association with mitochondria is more labile, leading to an increase in functional oligomers during mitosis. A, HeLa cells transfected with DRP1-YFP were synchronized with thymidine or nocodazole. The nocodazole was washed out for 60 min to facilitate a more complete attachment of the cells to the coverslips during imaging. Cells were labeled with Mitofluor Red 633 and the extent of DRP1-YFP recovery after photobleaching is equivalent in both thymidine- and nocodazole-synchronized cells. B, the quantification of fluorescence recovery after the bleach shows that the rates of recovery are distinct. The average curves are shown from (n = 3) thymidine- and (n = 2) nocodazole-treated cells. The lines indicate the initial slopes of DRP1-YFP recovery following the bleach. Quantification of the slopes are indicated along with the statistical significance (inset). C, HeLa cells synchronized with thymidine or nocodazole were harvested, and the post-nuclear supernatants were incubated with increasing concentrations of bis(maleimido)hexane (BMH) cross-linker, as indicated. Western blots with anti-DRP1 antibodies reveal the enrichment of oligomeric forms of DRP1, which is specific to the nocodazole-treated cells (asterisks). HSP70 antibodies control for equal loading in each lane, where cyclins A and B indicate the efficiency of synchronization.
FIGURE 6.
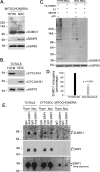
Mitochondrial SUMOylation is decreased during mitosis. A, sHeLa cells were grown in suspension and synchronized for 20 h with either 2 m
m
thymidine or 100 ng/ml nocodazole, then harvested and processed for mitochondria purification. SUMO1-conjugated targets in G1/S (thymidine) versus mitotic (nocodazole) mitochondria. Mitochondria isolated from the synchronized cells show a decrease in endogenous SUMO1 conjugates, concomitant with the recruitment of SenP5 during mitosis (HSP60 shown as internal loading control). B, aliquots of the total cell fractions were probed for cyclin A and cyclin B1 to monitor the synchronization efficiency (HSP70 was used as loading control). C, mitochondria were incubated in the indicated conditions (“Experimental Procedures”) and probed for the association of conjugated His6-SUMO1. The conjugation of SUMO1 to the mitochondrial targets is ATP dependent. HSP60 was probed to monitor mitochondrial loading. D, the data from three independent conjugation experiments, using mitochondria from two independent fractionations were quantified and, after subtraction of background signal (−ATP conditions), the percentage of total SUMO1 conjugates intensity are plotted in G1/S and G2/M. E, sHeLa cells synchronized as indicated were fractionated into cytosol or mitochondrial fractions, solubilized, and anti-DRP1 antibodies used to immunoprecipitate endogenous DRP1. Extracts were loaded on two independent gels, with one probed with anti-SUMO1 antibodies, and the other with DRP1 antibodies. The data shows that DRP1 immunoprecipitates are immunoreactive for SUMO1, with a higher migrating species being lost specifically when SenP5 is delivered to the mitochondria in nocodazole-synchronized cells (asterisk).
FIGURE 7.
Schematic of SenP5 transition and the DRP1 SUMOylation cycle. A, illustrates the translocation of SenP5 from the nucleoli to the mitochondria at G2/M, which coincides with the global deSUMOylation of mitochondrial targets and increase in mitochondrial fission. B, our data indicates that the SUMOylation cycle of DRP1 is enhanced upon delivery of SenP5 to the membrane. The deSUMOylation of DRP1 helps to drive the oligomerization of DRP1, which promotes mitochondrial fission during mitosis.
Similar articles
- The SUMO protease SENP5 is required to maintain mitochondrial morphology and function.
Zunino R, Schauss A, Rippstein P, Andrade-Navarro M, McBride HM. Zunino R, et al. J Cell Sci. 2007 Apr 1;120(Pt 7):1178-88. doi: 10.1242/jcs.03418. Epub 2007 Mar 6. J Cell Sci. 2007. PMID: 17341580 - Mitotic phosphorylation of dynamin-related GTPase Drp1 participates in mitochondrial fission.
Taguchi N, Ishihara N, Jofuku A, Oka T, Mihara K. Taguchi N, et al. J Biol Chem. 2007 Apr 13;282(15):11521-9. doi: 10.1074/jbc.M607279200. Epub 2007 Feb 14. J Biol Chem. 2007. PMID: 17301055 - Bax/Bak promote sumoylation of DRP1 and its stable association with mitochondria during apoptotic cell death.
Wasiak S, Zunino R, McBride HM. Wasiak S, et al. J Cell Biol. 2007 May 7;177(3):439-50. doi: 10.1083/jcb.200610042. Epub 2007 Apr 30. J Cell Biol. 2007. PMID: 17470634 Free PMC article. - Dynamic regulation of mitochondrial fission through modification of the dynamin-related protein Drp1.
Chang CR, Blackstone C. Chang CR, et al. Ann N Y Acad Sci. 2010 Jul;1201:34-9. doi: 10.1111/j.1749-6632.2010.05629.x. Ann N Y Acad Sci. 2010. PMID: 20649536 Free PMC article. Review. - [Mechanism of mitochondrial fission - structure and function of Drp1 protein].
Michalska B, Duszyński J, Szymański J. Michalska B, et al. Postepy Biochem. 2016;62(2):127-137. Postepy Biochem. 2016. PMID: 28132464 Review. Polish.
Cited by
- Metabolic and cell cycle shift induced by the deletion of Dnm1l attenuates the dissolution of pluripotency in mouse embryonic stem cells.
Seo BJ, Na SB, Choi J, Ahn B, Habib O, Park C, Hong K, Do JT. Seo BJ, et al. Cell Mol Life Sci. 2023 Sep 25;80(10):302. doi: 10.1007/s00018-023-04962-x. Cell Mol Life Sci. 2023. PMID: 37747543 Free PMC article. - Convergent and divergent mechanisms of peroxisomal and mitochondrial division.
Subramani S, Shukla N, Farre JC. Subramani S, et al. J Cell Biol. 2023 Sep 4;222(9):e202304076. doi: 10.1083/jcb.202304076. Epub 2023 Aug 2. J Cell Biol. 2023. PMID: 37530713 Free PMC article. - Post-Translational Modification of Cysteines: A Key Determinant of Endoplasmic Reticulum-Mitochondria Contacts (MERCs).
Bassot A, Chen J, Simmen T. Bassot A, et al. Contact (Thousand Oaks). 2021 Mar 24;4:25152564211001213. doi: 10.1177/25152564211001213. eCollection 2021 Jan-Dec. Contact (Thousand Oaks). 2021. PMID: 37366382 Free PMC article. Review. - Optogenetically engineered Ca2+ oscillation-mediated DRP1 activation promotes mitochondrial fission and cell death.
Lai YS, Chang CC, Chen YY, Nguyen TMH, Xu J, Chen YC, Chang YF, Wang CY, Chen PS, Lin SC, Peng IC, Tsai SJ, Chiu WT. Lai YS, et al. J Cell Sci. 2023 Jun 15;136(12):jcs260819. doi: 10.1242/jcs.260819. Epub 2023 Jun 21. J Cell Sci. 2023. PMID: 37232206 Free PMC article. - Novel insights into the involvement of mitochondrial fission/fusion in heart failure: From molecular mechanisms to targeted therapies.
Liu X, Guo C, Zhang Q. Liu X, et al. Cell Stress Chaperones. 2023 Mar;28(2):133-144. doi: 10.1007/s12192-023-01321-4. Epub 2023 Jan 18. Cell Stress Chaperones. 2023. PMID: 36652120 Free PMC article. Review.
References
- Mandal S., Guptan P., Owusu-Ansah E., Banerjee U. ( 2005) Dev. Cell 9, 843– 854 - PubMed
- Owusu-Ansah E., Yavari A., Mandal S., Banerjee U. ( 2008) Nat. Genet. 40, 356– 361 - PubMed
- Yaffe M. P. ( 1999) Science 283, 1493– 1497 - PubMed
- Boldogh I. R., Fehrenbacher K. L., Yang H. C., Pon L. A. ( 2005) Gene 354, 28– 36 - PubMed
- Taguchi N., Ishihara N., Jofuku A., Oka T., Mihara K. ( 2007) J. Biol. Chem. 282, 11521– 11529 - PubMed
Publication types
MeSH terms
Substances
LinkOut - more resources
Full Text Sources
Molecular Biology Databases
Miscellaneous
