Caveolae-mediated internalization of occludin and claudin-5 during CCL2-induced tight junction remodeling in brain endothelial cells - PubMed (original) (raw)
Caveolae-mediated internalization of occludin and claudin-5 during CCL2-induced tight junction remodeling in brain endothelial cells
Svetlana M Stamatovic et al. J Biol Chem. 2009.
Abstract
Disturbance of the tight junction (TJ) complexes between brain endothelial cells leads to increased paracellular permeability, allowing leukocyte entry into inflamed brain tissue and also contributing to edema formation. The current study dissects the mechanisms by which a chemokine, CCL2, induces TJ disassembly. It investigates the potential role of selective internalization of TJ transmembrane proteins (occludin and claudin-5) in increased permeability of the brain endothelial barrier in vitro. To map the internalization and intracellular fate of occludin and claudin-5, green fluorescent protein fusion proteins of these TJ proteins were generated and imaged by fluorescent microscopy with simultaneous measurement of transendothelial electrical resistance. During CCL2-induced reductions in transendothelial electrical resistance, claudin-5 and occludin became internalized via caveolae and further processed to early (EEA1+) and recycling (Rab4+) endosomes but not to late endosomes. Western blot analysis of fractions collected from a sucrose gradient showed the presence of claudin-5 and occludin in the same fractions that contained caveolin-1. For the first time, these results suggest an underlying molecular mechanism by which the pro-inflammatory chemokine CCL2 mediates brain endothelial barrier disruption during CNS inflammation.
Figures
FIGURE 1.
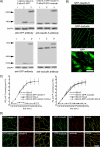
A, whole cell lysates of mock transfected bEnd.3 cells (1), bEnd.3 cells transfected with AcGFP plasmid (2), and bEnd.3 cells transfected with GFP-claudin-5 (3) or GFP-occludin (3*) plasmid were immunoblotted with anti-claudin-5 or anti-occludin antibodies and anti-GFP antibody. In each lane the same amount of total protein was applied. B, bEnd.3 cells stably transfected with GFP-claudin-5 or GFP-occludin expressed the tagged protein at cell borders. In bEnd.3 cells transfected with AcGFP only (GFP), staining was not localized to the cell border. Scale bar, 20 μm. C, permeability coefficient for inulin-FITC in two stably transfected bEnd.3 cell lines expressing GFP-claudin-5 and GFP-occludin, treated without or with CCL2 (100 ng/ml) for 2 h. D, staining with anti-claudin-5 and anti-ZO-1 or anti-occludin and anti-ZO-1 antibodies, confirmed the correct localization of GFP-claudin-5 and GFP-occludin proteins in bEnd.3 cells, with colocalization in merged images. Scale bar, 20 μm.
FIGURE 2.
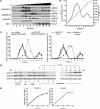
A, mBMEC monolayers were treated with CCL2 (100 ng/ml) in serum-free medium for the indicated periods (0–120 min). TEER was evaluated during this time period by ECIS assay. In a separate set of experiments after 60 min of CCL2 treatment (100 ng/ml), the CCL2 was removed by replacing media with fresh DMEM, and the cells were observed for an additional 60 min (+recovery). Each TEER tracing represents an average of three replicate wells and from three independent experiments. Impedance values were normalized by dividing by the impedance measured just prior to the addition of CCL2. B, the value of TEER of brain endothelial barrier in the presence or absence of CCL2 and 5 μg/ml cycloheximide (CHX) or 1 μ
m
lactacystein (LC) as well as during the recovery time. Both inhibitors, CHX and LC, did not disturb the brain endothelial barrier opening or recovery. Data represent an average ± S.D. for n = 5 independent experiments. C, time-lapse confocal microscopy. bEnd.3 monolayers, expressing either GFP-claudin-5 or GFP-occludin, were exposed to CCL2 (100 ng/ml). Images were obtained every 5 min over a time period of 0–120 min. After 60 min of treatment, CCL2 was removed from cells by replacing media with fresh DMEM, and the cells were observed for an additional 60 min. The representative images show some critical time points during CCL2-induced alterations in brain endothelial barrier permeability and during recovery. There is a fragmented pattern of occludin and claudin-5 staining at the cell-cell border of endothelial cells during CCL2 exposure, but this returns to a “control” pattern of staining along the cell borders after CCL2 removal. *, the location shown in magnification in the lower images; arrows indicate alterations in the localization GFP-claudin-5 and GFP-occludin in the presence of CCL2. Scale bar, 20 μm. D, biochemical changes in occludin and claudin-5 after CCL2 treatment. There was a redistribution of these proteins first from the membrane fraction (MF, Triton X-100-insoluble) to cytosolic (CF, Triton X-100-soluble) and actin cytoskeletal (ACF, Triton X-100-insoluble) fractions during CCL2 exposure and back to membrane fraction after removing CCL2 stimulus. To demonstrate the purity of the different fractions, cytochrome P-450 reductase, calpain, and vimentin were used as specific markers for membrane, cytosolic, and actin cytoskeletal fractions, respectively. While affecting fractional distribution of claudin-5 and occludin, CCL2 and its removal did not affect the total protein content of either protein. Blots represent one of three successful experiments.
FIGURE 3.
Time-lapse microscopical analysis of GFP-claudin-5 and GFP-occludin internalization. A, monolayers of bEnd.3 cells were directly seeded on a eight-well gold electrode array (ECIS system) and exposed to tracer for 30 min at 4 °C. CCL2 (100 ng/ml) was then added, and samples were placed in a temperature hood at 37 °C for 0–120 min. To trace internalization pathways we used Alexa596-cholera toxin conjugate (CT, 5 μg/ml) and BODIPY-TR-ceramide (5 μ
m
), which are specifically taken up via caveolae, Texas Red-transferrin conjugate (TR, 10 μg/ml), which is specifically taken up via clathrin-coated vesicles, and Dextran 10-kDa-Texas Red conjugate (0.5 mg/ml), which is specifically taken up via pinocytotic vacuoles or vacuole-associated actin. Example images are of the bEnd.3 cells exposed to CCL2 for 15 min. Higher magnification images of the boxed regions show localization/colocalization of certain tracers and GFP-claudin-5 and GFP-occludin. Cell outlines are delineated by dashed white lines. Scale bar, 10 μm. B and C, quantification of colocalization of transmembrane TJ proteins claudin-5 (B) and occludin (C) with internalization vesicles based on the Pearson's correlation coefficient of GFP-claudin-5/ALEXA596-cholera toxin, GFP-claudin-5/BODIPY-TR ceramide, GFP-claudin-/Transferrin-Texas Red, GFP-claudin-5/Dextran-Texas Red, GFP-occludin/Alexa596-cholera toxin, GFP-occludin/BODIPY-TR ceramide, GFP-occludin/Transferrin-Texas Red, and GFP-occludin/Dextran Texas Red. There was a high degree of correlation between total claudin-5 and cholera toxin or BODIPY-TR ceramide (B) as well as occludin and cholera toxin or BODIPY-TR ceramide (C). Other tracers did not show any colocalization pattern. Error bars indicate ± S.D.
FIGURE 4.
A, mBMEC monolayers were treated with CCL2 for 30 min at 37 °C, and Triton X-100-soluble and Triton X-100-insoluble fractions were prepared. The Triton X-100-insoluble fraction was layered on a 5–40% sucrose gradient, and 12 fractions were separated (1–12). All fractions were analyzed by Western blotting using an anti-caveolin-1, -claudin-5, and -occludin antibodies. The caveolin-containing fractions (4–6 and 10–12) also contained claudin-5 and occludin in CCL2-treated mBMEC. B, each collected fraction (1 ml of total volume) was first analyzed for protein concentration (○) and sucrose density (●) using a refractometer before Western blot analysis was performed. This graph represents at least five independent experiments. C, relative levels of occludin and claudin-5 in individual fractions from control cells or cells treated with CCL2 for 30 min. The collected fractions were subjected to Western blot analysis, obtained data were scanned, and bands were analyzed by densitometry using ImageJ software. The graphs represent at least five independent experiments. Under control conditions a large portion of claudin-5 and occludin is in fractions 7 and 8, fractions without caveolin 1. However, after CCL2 treatment, claudin-5 and occludin are found in fractions 4, 5, 6, 11, and 12. These fractions are those containing caveolin-1. CCL2 had no apparent effect on the distribution of caveolin-1 between different fractions. D, internalization of surface biotinylated claudin-5 and occludin proteins. Confluent mBMECs, treated with and without cycloheximide (CHX), were surface-biotinylated at 0 °C and then exposed to CCL2 for 30 min at 37 °C to allow internalization. Any membrane-bound biotin was removed by glutathione solution (glutathione stripping, gs). Lanes 1 and 2, biotinylated claudin-5 and occludin at the cell surface; lane 3, glutathione stripping of surface biotin; lanes 4 and 5, total cell lysate; lanes 6–9, portion of biotinylated internalized proteins. Adjusted blot showing the time course (0–60 min) of internalized biotinylated claudin-5 and occludin during mBMEC exposure to CCL2. E, quantification of internalized occludin and claudin-5 during the exposure to CCL2 and opening of brain endothelial barrier. The percentage of internalized protein was estimated as the percentage of total biotinylated occludin and claudin-5. GADPH represents an internal loading control. Data represent average ± S.D. of five independent experiments.
FIGURE 5.
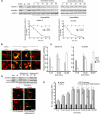
A, to confirm that CCL2-induced claudin-5 and occludin internalization was via a caveolae-dependent pathway, we performed inhibition studies using Filipin III (10 ng/ml) or caveolin-1 siRNA. As expected, GFP-claudin-5- and GFP-occludin-expressing bEnd.3 cells exposed to mock transfection showed internalization of GFP-claudin-5 and GFP-occludin in the presence of CCL2 (100 ng/ml). In contrast, inhibition of caveolae formation with either Filipin III or transient transfection with caveolin-1 siRNA prevented CCL2-induced internalization (i.e. GFP-claudin-5 and GFP-occludin remained at cell borders). Reduction in clathrin vesicle formation with α-adaptin siRNA had no effect on internalization. Control indicated bEnd.3 GFP-claudin-5 or GFP-occludin cells immunostained with caveolin-1 or α-adaptin in the resting condition (non-treated with CCL2). Samples were viewed on a Zeiss LSM 510 confocal microscopy (scale bar, 20 μm). Arrowhead, localization of GFP-claudin-5 and GFP-occludin in the presence or absence of CCL2 (higher magnification insets). B, effect of inhibition of select endocytotic pathways on CCL2-induced hyper-permeability of mBMEC monolayers to inulin-FITC. CCL2 induced a marked increase in permeability versus control cells. This was significantly diminished in the presence of the following inhibitors Filipin III (10 ng/ml), MβCD (10 μ
m
), 5-(_N_-ethyl-_N_-isopropyl)amiloride (EIPA, 10 μ
m
) or after transient transfection with caveolin-1 siRNA but not sucrose (0.4
m
) or after transient transfection with α-adaptin siRNA. Control, cells not treated with CCL2 but treated with one of the inhibitors or siRNA. CCL2 or CCL2+inhibitor, denote cells pretreated/treated with inhibitor or siRNA oligonucleotide and exposed then to CCL2 (100 ng/ml). Data represent the value of PC after 60 min of CCL2 exposure and are the average ± S.D. of three independent experiments. *, p < 0.01; **, p < 0.001 versus CCL2 alone. C, internalization of occludin and claudin-5 during CCL2-induced brain endothelial barrier opening was also cholesterol-sensitive. Biotin-labeled occludin and claudin-5 were not internalized in the presence of the cholesterol-depleting agent MβCD (10 μ
m
). However, replacing the cholesterol (400 μg/ml) in MβCD-treated cells reversed this effect, with resumption of CCL2-induced internalization of biotin-labeled claudin-5 and occludin. The blot represents one of five independent experiments. Graphs represent densitometric analysis of internalized biotin labeled occludin and claudin-5 during the treatment with CCL2 at the indicated times (15 and 60 min). Data represent the average ± S.D. of three independent experiments. **, p < 0.001 versus CCL2 alone.
FIGURE 6.
A, loss of internalized-biotinylated claudin-5 and occludin after removal of CCL2 (recovery). Monolayers of mBMEC were biotinylated (biotin) and exposed to CCL2 (100 ng/ml) for 1 h at 37 °C. Remaining surface biotin was then glutathione stripped (gs), and the cells returned to fresh media without CCL2 at 37 °C. Over 0–60 min of recovery there was a reduction in the amount of intracellular biotinylated occludin and claudin-5. Recycling was absent when CCL2 was still present in the bathing media (no recovery). GADPH is an internal loading control. The graphs show quantification of internalized and recycling occludin and claudin-5 during recovery after CCL2 treatment. Data represent average ± S.D. of five independent experiments. B, monolayers of bEnd.3 cells expressing either GFP-occludin or GFP-claudin-5 were treated with CCL2 (100 ng/ml) for 15–60 min. Cells were fixed and immunocytochemistry performed. Recycling endosomes were labeled with mouse anti-Rab4 antibody; early endosomes with anti-EEA1 antibody, lysosomes with anti-LAMP2 antibody. The colocalizations of GFP-claudin-5 and GFP-occludin with EEA1+ and Rab4+ endosomes are indicated with arrows. Scale bar, 20 μm. C, quantification of colocalization of claudin-5 and occludin with endosomal markers EEA1, Rab4, and LAMP2 during CCL2 exposure (0–60 min). The high degree of correlation between total claudin-5 and EEA1 or Rab4 as well as occludin and EEA1 or Rab4 was time-dependent. The colocalization was evaluated by calculating the Pearson correlation coefficient (_R_r). Error bars indicate ± S.D. D, removal of CCL2 (recovery) for 60 min after 60-min exposure to CCL2 led to a loss of Rab4 colocalization with GFP-claudin-5 and GFP-occludin (compare with B). In addition, the vesiculo-vacuolar system was analyzed during recovery (CCL2 removal). Arrowhead indicates continuous staining for GFP-occludin and GFP-claudin-5, whereas Rab4+ endosomes were empty of these proteins. Adding the inhibitor bafilomycin A1 (50 n
m
) prevented the emptying of Rab4+ endosomes and re-establishment of interendothelial localization for GFP-occludin and GFP-claudin-5. Bafilomycin A1 also prevented recycling of biotin-labeled occludin and claudin-5 during recovery. In the absence, but not presence, of bafilomycin A1 there was a loss of intracellular biotinylated occludin and claudin-5 during recovery after exposure to CCL2. One representative blot of five independent experiments. E, blocking recycling of occludin and claudin-5 with bafilomycin A1 prevented the reestablishment of mBMEC monolayer integrity after CCL2 removal. Cells were treated with/without CCL2 for 60 min, and then medium was replaced with medium without CCL2 (recovery). The inhibitor bafilomycin A1 was added to the cells at the beginning of recovery time. The collected media from the bottom channels were analyzed, and the permeability coefficient for inulin-FITC was calculated. Data represent average ± S.D. from five independent experiments.
Similar articles
- Actin depolymerization disrupts tight junctions via caveolae-mediated endocytosis.
Shen L, Turner JR. Shen L, et al. Mol Biol Cell. 2005 Sep;16(9):3919-36. doi: 10.1091/mbc.e04-12-1089. Epub 2005 Jun 15. Mol Biol Cell. 2005. PMID: 15958494 Free PMC article. - Ethanol-induced activation of myosin light chain kinase leads to dysfunction of tight junctions and blood-brain barrier compromise.
Haorah J, Heilman D, Knipe B, Chrastil J, Leibhart J, Ghorpade A, Miller DW, Persidsky Y. Haorah J, et al. Alcohol Clin Exp Res. 2005 Jun;29(6):999-1009. doi: 10.1097/01.alc.0000166944.79914.0a. Alcohol Clin Exp Res. 2005. PMID: 15976526 - Constitutive activation of Rho proteins by CNF-1 influences tight junction structure and epithelial barrier function.
Hopkins AM, Walsh SV, Verkade P, Boquet P, Nusrat A. Hopkins AM, et al. J Cell Sci. 2003 Feb 15;116(Pt 4):725-42. doi: 10.1242/jcs.00300. J Cell Sci. 2003. PMID: 12538773 - Endocytosis of tight junction proteins and the regulation of degradation and recycling.
Stamatovic SM, Johnson AM, Sladojevic N, Keep RF, Andjelkovic AV. Stamatovic SM, et al. Ann N Y Acad Sci. 2017 Jun;1397(1):54-65. doi: 10.1111/nyas.13346. Epub 2017 Apr 17. Ann N Y Acad Sci. 2017. PMID: 28415156 Free PMC article. Review. - Overcoming barriers in the study of tight junction functions: from occludin to claudin.
Tsukita S, Furuse M. Tsukita S, et al. Genes Cells. 1998 Sep;3(9):569-73. doi: 10.1046/j.1365-2443.1998.00212.x. Genes Cells. 1998. PMID: 9813107 Review.
Cited by
- Low-dose endothelial monocyte-activating polypeptide-ii increases permeability of blood-tumor barrier by caveolae-mediated transcellular pathway.
Li Z, Liu YH, Xue YX, Liu LB, Wang P. Li Z, et al. J Mol Neurosci. 2014 Mar;52(3):313-22. doi: 10.1007/s12031-013-0148-8. Epub 2013 Oct 25. J Mol Neurosci. 2014. PMID: 24526454 - Hello from the Other Side: How Autoantibodies Circumvent the Blood-Brain Barrier in Autoimmune Encephalitis.
Platt MP, Agalliu D, Cutforth T. Platt MP, et al. Front Immunol. 2017 Apr 21;8:442. doi: 10.3389/fimmu.2017.00442. eCollection 2017. Front Immunol. 2017. PMID: 28484451 Free PMC article. Review. - Caveolin1 Is Required for Th1 Cell Infiltration, but Not Tight Junction Remodeling, at the Blood-Brain Barrier in Autoimmune Neuroinflammation.
Lutz SE, Smith JR, Kim DH, Olson CVL, Ellefsen K, Bates JM, Gandhi SP, Agalliu D. Lutz SE, et al. Cell Rep. 2017 Nov 21;21(8):2104-2117. doi: 10.1016/j.celrep.2017.10.094. Cell Rep. 2017. PMID: 29166603 Free PMC article. - A review of the role of cav-1 in neuropathology and neural recovery after ischemic stroke.
Huang Q, Zhong W, Hu Z, Tang X. Huang Q, et al. J Neuroinflammation. 2018 Dec 20;15(1):348. doi: 10.1186/s12974-018-1387-y. J Neuroinflammation. 2018. PMID: 30572925 Free PMC article. Review. - Selective HDAC6 inhibition protects against blood-brain barrier dysfunction after intracerebral hemorrhage.
Peng C, Wang Y, Hu Z, Chen C. Peng C, et al. CNS Neurosci Ther. 2024 Mar;30(3):e14429. doi: 10.1111/cns.14429. Epub 2023 Sep 4. CNS Neurosci Ther. 2024. PMID: 37665135 Free PMC article.
References
- Garcia J. G., Schaphorst K. L. (1995) J. Invest. Med. 43, 117–126 - PubMed
- Harhaj N. S., Antonetti D. A. (2004) Int. J. Biochem. Cell Biol. 36, 1206–1237 - PubMed
- Bazzoni G. (2006) Thromb. Haemost. 95, 36–42 - PubMed
- Farshori P., Kachar B. (1999) J. Membr. Biol. 170, 147–156 - PubMed
- DeMaio L., Rouhanizadeh M., Reddy S., Sevanian A., Hwang J., Hsiai T. K. (2006) Am. J. Physiol. Heart Circ. Physiol. 290, H674–H683 - PubMed
Publication types
MeSH terms
Substances
LinkOut - more resources
Full Text Sources
Other Literature Sources
Miscellaneous


