Atg5-independent sequestration of ubiquitinated mycobacteria - PubMed (original) (raw)
Atg5-independent sequestration of ubiquitinated mycobacteria
Cathleen A Collins et al. PLoS Pathog. 2009 May.
Abstract
Like several other intracellular pathogens, Mycobacterium marinum (Mm) escapes from phagosomes into the host cytosol where it can polymerize actin, leading to motility that promotes spread to neighboring cells. However, only approximately 25% of internalized Mm form actin tails, and the fate of the remaining bacteria has been unknown. Here we show that cytosolic access results in a new and intricate host pathogen interaction: host macrophages ubiquitinate Mm, while Mm shed their ubiquitinated cell walls. Phagosomal escape and ubiquitination of Mm occurred rapidly, prior to 3.5 hours post infection; at the same time, ubiquitinated Mm cell wall material mixed with host-derived dense membrane networks appeared in close proximity to cytosolic bacteria, suggesting cell wall shedding and association with remnants of the lysed phagosome. At 24 hours post-infection, Mm that polymerized actin were not ubiquitinated, whereas ubiquitinated Mm were found within LAMP-1-positive vacuoles resembling lysosomes. Though double membranes were observed which sequestered Mm away from the cytosol, targeting of Mm to the LAMP-1-positive vacuoles was independent of classical autophagy, as demonstrated by absence of LC3 association and by Atg5-independence of their formation. Further, ubiquitination and LAMP-1 association did not occur with mutant avirulent Mm lacking ESX-1 (type VII) secretion, which fail to escape the primary phagosome; apart from its function in phagosome escape, ESX-1 was not directly required for Mm ubiquitination in macrophages or in vitro. These data suggest that virulent Mm follow two distinct paths in the cytosol of infected host cells: bacterial ubiquitination is followed by sequestration into lysosome-like organelles via an autophagy-independent pathway, while cell wall shedding may allow escape from this fate to permit continued residence in the cytosol and formation of actin tails.
Conflict of interest statement
The authors have declared that no competing interests exist.
Figures
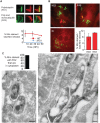
Figure 1. Mm escapes from phagosome by 3.5 HPI.
(A) 3.5 HPI with ΔRD1 (1st and 3rd rows) or WT (2nd and 4th rows) Mm expressing GFP, macrophages were permeabilized with digitonin alone (top two rows) or digitonin followed by TX-100 (3rd and 4th row) as described in Materials and Methods. Bacteria were stained with an anti-Mm antibody (1st column, red) and polymerized actin was visualized with phalloidin-Alexa 350 (2nd column, blue). Third column is a merge of the images in the first two columns. Inset in the first panel of the second row shows a 3.5 fold magnification of the cytosolic WT Mm in the larger panel, stained with the Mm antibody. (Scale bar, 10 µm). (B) Actin tails, identified by phalloidin-Alexa 350 after digitonin and TX-100 staining, were quantified by counting all bacteria from at least 50 infected macrophages for WT (squares, red line) and ΔRD1 (diamonds, blue line) at various times after infection in three independent experiments and graphed as mean±SD. (C) Epon section of a portion of a macrophage infected with WT Mm at 3.5 HPI. An asterisk denotes a Mm in the cytosol, an arrow points to Mm enclosed in phagosome membrane. AP, autophagosome; AL, autolysosome. Scale bar, 500 nm. (D) A macrophage infected with WT Mm expressing GFP 24 HPI stained for phalloidin-Alexa 350 (blue) as in (A) (Scale bar, 10 µm). This image shows Mm exhibiting robust actin motility within a single cell, and is shown to illustrate several examples of actin polymerization at 24 HPI; it is not representative of the average 10% polymerizing actin in the entire population of infecting Mm as quantitated in (B).
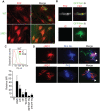
Figure 2. Cytosolic Mm associates with polyubiquitin.
(A) 48 HPI with WT Mm expressing GFP, macrophages were stained with antibodies for polyubiquitin (FK1) or poly- and monoubiquitin (FK2). Left panel, GFP fluorescence; middle panel, anti-ubiquitin fluorescence; right panel is a merge of the two other panels, showing co-localization of both anti-ubiquitin antibodies with Mm. (Scale bars, 1 µm). Graph shows quantification of percent FK2 staining of WT (squares, red line) and ΔRD1 (diamonds, blue line), Mm from at least 50 infected macrophages at each time point in three independent experiments and graphed as mean±SD. (B) 24 HPI post infection, macrophages were stained with monoclonal antibodies recognizing K63-linked polyubiquitin (left panel), K48-linked polyubiquitin (middle panel), or anti-her2 as an isotype control (IC). Specificity of linkage detection was demonstrated by competition with K48 or K63 tetraubiquitin chains (Figure S2A). Graph shows quantification of percent of intracellular WT Mm stained with K63- and K48- polyubiquitin linkage-specific antibodies in macrophages infected for 24 hours. The difference in K63 and K48 association with Mm were not statistically significant (P = 0.0662), determined as described in Materials and Methods. Data are from at least 50 infected macrophages at each time point in each of three independent experiments and graphed as mean±SD. (C) Ultrathin cryosection of 3.5 HPI of macrophages with WT Mm, labeled with FK2 anti-ubiquitin, and 10 nm protein-A gold particles. Left panel shows Mm with ubiquitin on bacterial surface, indicated with arrows. Right panel shows ubiquitin on membranous structures associated with Mm, labeled with an asterisk. Graph shows quantification percent of ubiquitin associated Mm which were cytosolic or intra-vacuolar. 48 out of 50 such organisms were cytosolic. Scale bars, 200 nm.
Figure 3. ESX-1 is necessary for Mm ubiquitination in macrophages.
(A) Macrophages were infected with WT (top panels) or ΔRD1 (bottom panels) Mm and stained with the FK2 antibody to poly- and monoubiquitin at 24 HPI (Scale bar, 10 µm). (B) Mm were ubiquitinated in vitro by incubating Mm with HeLa cell cytosolic extracts for 2 hours at 36°C as described in Materials and Methods. Polyubiquitination of bacteria was detected by immunofluorescence after staining with FK2; isotype control is an antibody to HIV gp120. (C) Flow cytometry was performed to quantify ubiquitination of Mm. Fluorescence of Mm incubated with HeLa cell extracts and stained as in (B) was measured using FACSCaliber. The histogram plot shows a representative log scale distribution of the number of bacteria (y axis) vs. fluorescence intensity for mAb staining of Mm (x axis) stained with antibody to poly- and monoubiquitin (FK2, green histogram) or with isotype control anti-gp120 antibody (IC, red histogram). The bar graph shows the ratio of mean fluorescent intensity of FK2 staining for each condition to ubiquitinated WT Mm stained with the isotype control antibody. Data expressed as mean±SD from three independent experiments. (D) Coinfection of macrophages with WT and ΔRD1 Mm. Macrophages were coinfected with WT Mm expressing GFP and ΔRD1 Mm expressing RFP at a ratio of 1∶1. 24 HPI macrophages were permeabilized with digitonin and stained with anti-Mm (top row, middle panel) to detect cytosolic bacteria, or with FK2 after permeabilization with Triton X-100 to detect bacterial ubiquitination (bottom row, middle panel). Merged images in the right panels show WT-GFP (green), ΔRD1-RFP Mm (red) and anti-Mm (blue in top panel) or FK2 (blue in bottom panel). Arrows point to ΔRD1-RFP Mm stained by anti-Mm in cytosol (top right) or ubiquitinated (bottom right). In absence of coinfection, ΔRD1 Mm were never seen ubiquitinated or found in cytosol (data not shown).
Figure 4. Sequestration of ubiquitinated Mm.
(A) 24 HPI with WT Mm expressing GFP, macrophages were permeabilized with Triton X-100 and stained with FK2 (blue, top right) and phalloidin-Alexa 594 (red, bottom left). In merged image (bottom right), ubiquitinated Mm (shown with asterisk) had no association with polymerized actin. The graph on the right shows the percentage of Mm with actin tails that also stain with FK2 quantified 24 and 48 HPI in fifty infected macrophages. Data shown as the mean±SD of three independent experiments. (B) 24 HPI with WT Mm, macrophages were permeabilized with digitonin (top row) or digitonin followed by Triton X-100 (bottom row) and subsequently stained with FK2 (blue). Merged images of the two panels is shown in the right panels. Maintenance of phagosome integrity after digitonin permeabilization was confirmed by lack of staining of ΔRD1 with the Mm antibody (data not shown). The graph on the right shows the percentage of ubiquitinated Mm at various times after infection in macrophages permeabilized with digitonin alone (diamonds, blue line) or with digitonin followed by Triton X-100 (squares, red line). Data are mean±SD of three independent experiments, each examining at least 50 infected macrophages at each time point.
Figure 5. Association of ubiquitinated Mm with LAMP-1.
(A) 48 HPI macrophages infected with GFP-expressing WT Mm were fixed and permeabilized with Triton X-100 and subsequently stained with FK2 (2nd panel, blue) and antibody to LAMP-1 (3rd panel, red). Merged images of the green, red, and blue fluorescence is shown in the right panel. Arrows point to bacteria showing co-localization of ubiquitin and LAMP-1, with top row showing LAMP-1 in discrete patches and bottom row showing ubiquitinated bacteria surrounded by LAMP-1. (B) Quantification of percent of ubiquitinated Mm that co-localize with LAMP-1 at various times after macrophage infection. Data are depicted as mean±SD of three independent experiments, with at least 50 macrophages counted per experiment. (C) Quantification of percent LAMP-1 positive Mm that ubiquitinated at various times after macrophage infection. Data are depicted as mean±SD of three independent experiments, with at least 50 macrophages counted per experiment. (D) Ultrathin cryosections of macrophages 24 HPI with WT Mm were double-labeled with anti–LAMP-1 (10 nm gold particles) and FK2 anti-ubiquitin (20 nm gold particles). Arrows point to examples of LAMP-1 labeling on membranes surrounding ubiquitinated Mm. Immediately adjacent to the Mm, ubiquitinated material (asterisk) is enclosed within a double membrane positive for LAMP-1 (arrowheads). Scale bar, 200 nm.
Figure 6. Atg5-independence of Mm sequestration.
(A) At 24 HPI, many Mm appear enclosed in membrane-lined compartments morphologically similar to autophagosomes and autolysosomes. The top image shows a bacterium in close association with a double membrane structure suggestive of an autophagosome (arrows). The double membranes also appear to extend around characteristic dense material (asterisk), similar to the ubiquitinated material shown adjacent to Mm in Figure 2C (right image). The bottom image shows Mm enclosed in an single membrane (auto)lysosomal vacuole containing a large amount of membranes and debris in addition to the bacteria, with dashes showing the outline of the vacuole. Scale bars, 200 nm. (B) Quantification of number of Mm in single membrane phagosomes (squares, red line), the cytosol with no associated membranes (diamonds, light blue line), in double membrane structures (triangles, green line) or single membrane lysosomes (circles, dark blue line) exemplified in Figure 6A. The 3.5 HPI data is from one experiment (N = 177) and the 24 HPI data is the average of two independent experiments (N = 138 and 160). (C) Autophagy was induced in macrophages by preincubating cells with rapamycin (squares, green line), or EBSS (triangles, red line) for 2 hours before infection. Control cells were incubated in standard macrophage growth media (diamonds, blue line). 4 or 24 HPI of these cells, the percentage of ubiquitinated bacteria co-localizing with LAMP-1 was determined as described in Figure 5. The graph shows the mean±SD of 50 cells per condition at each time point for three separate experiments. (D) ATG5−/− (top row) and ATG5+/+ (bottom row) MEFs were infected with GFP-expressing WT Mm for 24 hours and stained for ubiquitin (left panels, blue in merged image) and LAMP-1 (middle panels, red in merged image). As in macrophage infection, ubiquitinated Mm co-localizing with LAMP-1 are evident. (E) The percentage of ubiquitinated Mm co-localizing with LAMP-1 was determined at 5 and 24 HPI. Graph represents mean±SD of three independent experiments for ATG5+/+ MEFs (squares, red line) or ATG 5−/− MEFS (diamonds, blue line). At least 50 infected cells were counted at each time point in each experiment.
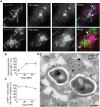
Figure 7. Release of ubiquitinated Mm surface molecules in macrophage cytosol.
(A) Macrophages infected for 3.5 hours with GFP-expressing Mm were permeabilized with digitonin and stained with anti-Mm antibody (left panel, red). Middle panel shows GFP fluorescence and right panel is a merged image of the green and red fluorescence. Arrow points to a region of Mm antibody staining distinct from intact bacteria. (B) Mm were labeled with CFSE prior to infection of macrophages, which were subsequently stained with FK2 anti-ubiquitin. CFSE fluorescence is shown in the left panel (green), and FK2 staining in the middle panel (red). Top two rows show 100× magnification of cells fixed at 6.5 HPI (Scale bar, 1 µm), demonstrating release of CFSE labeled, ubiquitinated material (arrows); bottom image shows a 60× magnification demonstrating multiple collections of released, ubiquitinated Mm material at 3.5 HPI (asterisks) (Scale bar, 10 µm). (C) Mm were labeled with CFSE as above for immunoelectron microscopy. Ultrathin cryosections of macrophages at 3.5 HPI were double-labeled with FK2 and anti-fluorescein, each followed by protein-A gold particles of the indicated sizes in nm. Both images of co-localization at the bacterial surface (upper image) and co-localization on the characteristic membranes (arrows) associated with the bacteria (upper and lower image) were obtained. Note that in the lower image, there is little staining of the bacterial surface with either anti- fluorescein or anti- ubiquitin. Scale bars, 200 nm. (D) Macrophages were infected with GFP-expressing Mm, stained with anti-Mm after digitonin permeabilization (left panel, red) and FK2 (middle panel, blue). Merge shows co-localization of anti-Mm with FK2 staining.
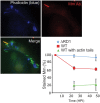
Figure 8. Alteration in Mm antigenicity during macrophage infection.
24 HPI with GFP-expressing WT Mm, macrophages were permeabilized with digitonin and Triton X-100 and stained with phalloidin-Alexa 350 (left panel, blue in bottom merged image) and anti-Mm (right panel, red in bottom merged image). Multiple cytosolic bacteria that polymerized actin failed to be recognized by anti-Mm. In bottom right panel, the percentage of infecting Mm that stained with the anti-Mm antibody was quantitated for ΔRD1 (diamonds, blue line) and WT Mm (squares, red line) during 48 h of infection. The percentage of WT with actin tails that stained with the anti-Mm antibody (triangles, green line) also was determined. Graph shows mean±SD for three independent experiments.
Figure 9. Alternative fates for cytosolic Mm during macrophage infection.
After uptake into a macrophage phagosome Mm (green bar) escapes quickly into the cytosol. Cytosolic Mm may be ubiquitinated, leading to resequestration of bacteria into a LAMP-1–positive vesicle. Alternatively, ubiquitinated bacteria may shed ubiquitin with components of the bacterial cell wall. Unubiquitinated bacteria polymerize actin.
Similar articles
- Cytosolic serpins act in a cytoprotective feedback loop that limits ESX-1-dependent death of _Mycobacterium marinum_-infected macrophages.
Nobs E, Laschanzky K, Munke K, Movert E, Valfridsson C, Carlsson F. Nobs E, et al. mBio. 2024 Sep 11;15(9):e0038424. doi: 10.1128/mbio.00384-24. Epub 2024 Aug 1. mBio. 2024. PMID: 39087767 Free PMC article. - The ESAT-6/CFP-10 secretion system of Mycobacterium marinum modulates phagosome maturation.
Tan T, Lee WL, Alexander DC, Grinstein S, Liu J. Tan T, et al. Cell Microbiol. 2006 Sep;8(9):1417-29. doi: 10.1111/j.1462-5822.2006.00721.x. Cell Microbiol. 2006. PMID: 16922861 - Extracellular M. tuberculosis DNA targets bacteria for autophagy by activating the host DNA-sensing pathway.
Watson RO, Manzanillo PS, Cox JS. Watson RO, et al. Cell. 2012 Aug 17;150(4):803-15. doi: 10.1016/j.cell.2012.06.040. Cell. 2012. PMID: 22901810 Free PMC article. - Interactions of Listeria monocytogenes with the autophagy system of host cells.
Lam GY, Czuczman MA, Higgins DE, Brumell JH. Lam GY, et al. Adv Immunol. 2012;113:7-18. doi: 10.1016/B978-0-12-394590-7.00008-7. Adv Immunol. 2012. PMID: 22244576 Review. - Inside or outside the phagosome? The controversy of the intracellular localization of Mycobacterium tuberculosis.
Welin A, Lerm M. Welin A, et al. Tuberculosis (Edinb). 2012 Mar;92(2):113-20. doi: 10.1016/j.tube.2011.09.009. Epub 2011 Oct 26. Tuberculosis (Edinb). 2012. PMID: 22033468 Review.
Cited by
- The impact of autophagic processes on the intracellular fate of Helicobacter pylori: more tricks from an enigmatic pathogen?
Deen NS, Huang SJ, Gong L, Kwok T, Devenish RJ. Deen NS, et al. Autophagy. 2013 May;9(5):639-52. doi: 10.4161/auto.23782. Epub 2013 Feb 8. Autophagy. 2013. PMID: 23396129 Free PMC article. Review. - Mycobacterium marinum antagonistically induces an autophagic response while repressing the autophagic flux in a TORC1- and ESX-1-dependent manner.
Cardenal-Muñoz E, Arafah S, López-Jiménez AT, Kicka S, Falaise A, Bach F, Schaad O, King JS, Hagedorn M, Soldati T. Cardenal-Muñoz E, et al. PLoS Pathog. 2017 Apr 17;13(4):e1006344. doi: 10.1371/journal.ppat.1006344. eCollection 2017 Apr. PLoS Pathog. 2017. PMID: 28414774 Free PMC article. - Prison break: pathogens' strategies to egress from host cells.
Friedrich N, Hagedorn M, Soldati-Favre D, Soldati T. Friedrich N, et al. Microbiol Mol Biol Rev. 2012 Dec;76(4):707-20. doi: 10.1128/MMBR.00024-12. Microbiol Mol Biol Rev. 2012. PMID: 23204363 Free PMC article. Review. - A glycine-rich PE_PGRS protein governs mycobacterial actin-based motility.
Hill NS, Welch MD. Hill NS, et al. Nat Commun. 2022 Jun 24;13(1):3608. doi: 10.1038/s41467-022-31333-0. Nat Commun. 2022. PMID: 35750685 Free PMC article. - Exploring host-pathogen interactions in the Dictyostelium discoideum-Mycobacterium marinum infection model of tuberculosis.
Guallar-Garrido S, Soldati T. Guallar-Garrido S, et al. Dis Model Mech. 2024 Jul 1;17(7):dmm050698. doi: 10.1242/dmm.050698. Epub 2024 Jul 22. Dis Model Mech. 2024. PMID: 39037280 Free PMC article. Review.
References
- Stamm LM, Brown EJ. Mycobacterium marinum: the generalization and specialization of a pathogenic mycobacterium. Microbes Infect. 2004;6:1418–1428. - PubMed
- Tobin DM, Ramakrishnan L. Comparative pathogenesis of Mycobacterium marinum and Mycobacterium tuberculosis. Cell Microbiol. 2008;10:1027–1039. - PubMed
- Pym AS, Brodin P, Brosch R, Huerre M, Cole ST. Loss of RD1 contributed to the attenuation of live tuberculosis vaccines Mycobacterium bovis BCG and Mycobacterium microti. Mol Microbiol. 2002;46:709–717. - PubMed
- Tan T, Lee WL, Alexander DC, Grinstein S, Liu J. The ESAT-6/CFP-10 secretion system of Mycobacterium marinum modulates phagosome maturation. Cell Microbiol. 2006;8:1417–1429. - PubMed
Publication types
MeSH terms
Substances
LinkOut - more resources
Full Text Sources
Miscellaneous


