CHARMM: the biomolecular simulation program - PubMed (original) (raw)
Review
. 2009 Jul 30;30(10):1545-614.
doi: 10.1002/jcc.21287.
C L Brooks 3rd, A D Mackerell Jr, L Nilsson, R J Petrella, B Roux, Y Won, G Archontis, C Bartels, S Boresch, A Caflisch, L Caves, Q Cui, A R Dinner, M Feig, S Fischer, J Gao, M Hodoscek, W Im, K Kuczera, T Lazaridis, J Ma, V Ovchinnikov, E Paci, R W Pastor, C B Post, J Z Pu, M Schaefer, B Tidor, R M Venable, H L Woodcock, X Wu, W Yang, D M York, M Karplus
Affiliations
- PMID: 19444816
- PMCID: PMC2810661
- DOI: 10.1002/jcc.21287
Review
CHARMM: the biomolecular simulation program
B R Brooks et al. J Comput Chem. 2009.
Abstract
CHARMM (Chemistry at HARvard Molecular Mechanics) is a highly versatile and widely used molecular simulation program. It has been developed over the last three decades with a primary focus on molecules of biological interest, including proteins, peptides, lipids, nucleic acids, carbohydrates, and small molecule ligands, as they occur in solution, crystals, and membrane environments. For the study of such systems, the program provides a large suite of computational tools that include numerous conformational and path sampling methods, free energy estimators, molecular minimization, dynamics, and analysis techniques, and model-building capabilities. The CHARMM program is applicable to problems involving a much broader class of many-particle systems. Calculations with CHARMM can be performed using a number of different energy functions and models, from mixed quantum mechanical-molecular mechanical force fields, to all-atom classical potential energy functions with explicit solvent and various boundary conditions, to implicit solvent and membrane models. The program has been ported to numerous platforms in both serial and parallel architectures. This article provides an overview of the program as it exists today with an emphasis on developments since the publication of the original CHARMM article in 1983.
Copyright 2009 Wiley Periodicals, Inc.
Figures
Figure 1
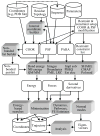
Diagram depicting the general scheme of the information flow in a CHARMM project. Information from data and parameter files (top row cylinders) and the input file (2nd row trapezoid) is first used to fill CHARMM data structures, which are then used by the energy routines and related modules (some of which are listed in the central grey box) to calculate the energy and its derivatives. This information is then used by various CHARMM modules for production calculations (second row from the bottom), which generate data in output files or internal data structures (bottom row) that are analyzed to obtain final results. Key: cylinders—data files; trapezoid—input file; white rectangles—data structures; shaded rectangles—CHARMM functionalities/modules; PDB—protein data bank; COOR, PSF, and PARA—internal CHARMM data structures for system coordinates, system topology/connectivity (“protein structure file”), and energy function parameters, respectively; NB energy non-bonded energy; QM/MM—combined quantum mechanical/molecular mechanical methods; PME—Particle-Mesh Ewald summation method; LRC—long range-corrections for truncated van der Waals interactions; Impl solv—implicit solvation models; PBEQ—Poisson-Boltzmann electrostatics module; Ext elec—Extended electrostatics;—CMAP backbone dihedral angle correction term for all-atom protein representation; Pol mod—polarizable models; Pathways—reaction pathway calculations; FE estimates—methods for estimating free energy differences.
Figure 2
CHARMM input file for an MD simulation of BPTI and a simple analysis of the resulting trajectory. This is similar in form to that used in the first MD simulation of a protein. The example uses the CHARMM22 all-hydrogen force field, with topology descriptions for standard amino acids and the interaction parameters in the text files “top_all22_prot.inp” and “par_all22_prot.inp,” respectively. A PDB file is used to provide the amino acid sequence and the atomic coordinates; depending on the source of the PDB file, some manual editing may be required. Coordinates for hydrogen atoms are constructed using the HBUILD algorithm, SHAKE constraints are applied to all bonds, and the dynamics run is started at 35K with heating in 50K increments at 0.2 ps intervals to a final temperature of 285K. Specifications for the calculation of non-bonded interactions are also given on the dynamics command line. Coordinates are saved every 100 steps to a binary file, which is re-opened after the simulation and used to compute the average structure and RMS fluctuations. Other examples can be found at
.
Figure 3
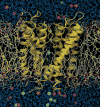
The KcsA K+ channel (helical ribbons) embedded in an explicit dipalmitoyl phosphatidylcholine (DPPC) phospholipid membrane (stick figures; fatty acids are white and head groups are red, green, and white) bathed by a 150 mM KCl aqueous salt solution (blue and green spheres represent potassium and chloride ions, respectively, and water molecules outside the membrane are shown in blue). The simulation system, consisting of 40,000 atoms, was used to compute a multi-ion PMF governing ion conduction through the channel and to determine the sources of its ionic selectivity. (from Bernèche & Roux33).
Figure 4
Four different (A-D) ligand escape pathways (shown as grey spheres along black guiding lines) identified using Random Acceleration Molecular Dynamics in the ligand binding domain of the retinoic acid receptor. Helices are shown as ribbons, and the retinoic acid ligand in the bound initial state is shown as red and gold spheres. (From Carlsson _et al._35).
Figure 5
Combining replica-exchange molecular dynamics with implicit solvent.a) Folding of the Trp-zip peptide. A consistent parameterization of the CHARMM all-hydrogen force field and the GBSW implicit solvent model was used, with 16 replicas in a temperature range of 270K to 550K. The left panel shows the distribution of potential energy values from the 270 K window. The right panel provides a comparison of the most populated cluster from the simulations and the NMR-derived structure; the backbone RMSD between the two structures is 1 Å. b) Implicit membrane/implicit solvent replica-exchange molecular dynamics simulations of a designed 19-residue peptide, WALP-19. The peptide inserts into the membrane via a mechanism involving the following steps: 1) migration to the membrane-water interface as a partially unstructured peptide; 2) formation of helical structure via D-hairpin conformations; 3) helical elongation through thermal fluctuations to ~80% helical; and 4) N-terminal insertion across the membrane.
Figure 6
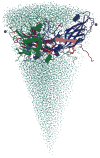
The protomeric unit of HRV14 (ribbon) capsid comprising VP1 (blue), VP2 (green), VP3 (red), and VP4 (yellow) peptide chains and two calcium ions (purple spheres). The protomer is solvated on the inside and outside with water molecules shown as small cyan spheres (which fill the interior of the capsid space). The primary unit has 12,432 protein atoms and 19,953 water atoms. Symmetry conditions, imposed through the use of the general image facility in CHARMM, model the entire virus capsid of approximately 750,000 atoms. This illustrates the use of molecular symmetry in the CHARMM program to reduce the size of a calculation in large systems.
Figure 7
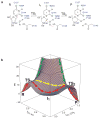
Reaction mechanism of the excision of misincorporated deoxyuridinefrom DNA by the uracil-DNA glycosylase UDG. a) Schematic diagram. Electron transfers are indicated in red, hydrogen bonds in green and enzyme residues in blue. The dashed line to C157 indicates a Cα Hα···O4 hydrogen bond.b) Adiabatic potential energy surface as a function of_r_C1′ N1 and_r_C1′ OH2. In the region_r_C1′ N1 ≤ 2.20 Å and _r_C1′ OH2 ≤ 2.00 Å, the points above 32 kcal/mol are not shown for clarity. Red arrows follow the lowest energy pathway (stepwise dissociative); green arrows follow a perfect associative pathway; and yellow arrows follow a concerted pathway starting from the reactant structure. The states indicated are reactant (R), product (P), transition states (TS1 and TS2) and the oxocorbenium cation/anion intermediate (I1). (From Dinner _et al._637).
Figure 8
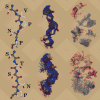
Six-panel figure depicting the results of a simulated annealing procedure for an antigenic peptide (top row) and an escape mutant (bottom row). The left hand column shows the peptide sequences in the reference orientation used to align the backbones for the middle and right hand columns. The middle column shows the aligned backbones and the right hand column shows only the side chains, in the same alignment, for the final coordinates from 100 simulated annealing runs. The small Val-Pro hydrophobic patch readily apparent in the top right panel is a likely antibody recognition site. Each panel was produced from POV-Ray files exported via the CHARMM graphics facility; the files were edited to add the background and transparency features, and then processed into images via the POV-Ray program.
Figure 9
Water molecules migrating through a model of the aquaporin channel, depicted by a superposition of 100 snapshots from a 10-ns dynamics trajectory. The aquaporin tetramer is shown in blue and the lipid bilayer membrane in which it is embedded is shown in yellow (head groups) and green (hydrocarbon tails).
Similar articles
- CHARMM additive and polarizable force fields for biophysics and computer-aided drug design.
Vanommeslaeghe K, MacKerell AD Jr. Vanommeslaeghe K, et al. Biochim Biophys Acta. 2015 May;1850(5):861-871. doi: 10.1016/j.bbagen.2014.08.004. Epub 2014 Aug 19. Biochim Biophys Acta. 2015. PMID: 25149274 Free PMC article. Review. - CHARMM general force field: A force field for drug-like molecules compatible with the CHARMM all-atom additive biological force fields.
Vanommeslaeghe K, Hatcher E, Acharya C, Kundu S, Zhong S, Shim J, Darian E, Guvench O, Lopes P, Vorobyov I, Mackerell AD Jr. Vanommeslaeghe K, et al. J Comput Chem. 2010 Mar;31(4):671-90. doi: 10.1002/jcc.21367. J Comput Chem. 2010. PMID: 19575467 Free PMC article. - The Amber biomolecular simulation programs.
Case DA, Cheatham TE 3rd, Darden T, Gohlke H, Luo R, Merz KM Jr, Onufriev A, Simmerling C, Wang B, Woods RJ. Case DA, et al. J Comput Chem. 2005 Dec;26(16):1668-88. doi: 10.1002/jcc.20290. J Comput Chem. 2005. PMID: 16200636 Free PMC article. - Comparison of protein force fields for molecular dynamics simulations.
Guvench O, MacKerell AD Jr. Guvench O, et al. Methods Mol Biol. 2008;443:63-88. doi: 10.1007/978-1-59745-177-2_4. Methods Mol Biol. 2008. PMID: 18446282 Review. - CHARMM-GUI 10 years for biomolecular modeling and simulation.
Jo S, Cheng X, Lee J, Kim S, Park SJ, Patel DS, Beaven AH, Lee KI, Rui H, Park S, Lee HS, Roux B, MacKerell AD Jr, Klauda JB, Qi Y, Im W. Jo S, et al. J Comput Chem. 2017 Jun 5;38(15):1114-1124. doi: 10.1002/jcc.24660. Epub 2016 Nov 14. J Comput Chem. 2017. PMID: 27862047 Free PMC article. Review.
Cited by
- The Evolution of the Acylation Mechanism in _β_-Lactamase and Rapid Protein Dynamics.
Frost CF, Antoniou D, Schwartz SD. Frost CF, et al. ACS Catal. 2024 Sep 20;14(18):13640-13651. doi: 10.1021/acscatal.4c03065. Epub 2024 Aug 28. ACS Catal. 2024. PMID: 39464311 - An artificial neural network approach to improving the correlation between protein energetics and the backbone structure.
Fawcett TM, Irausquin SJ, Simin M, Valafar H. Fawcett TM, et al. Proteomics. 2013 Jan;13(2):230-8. doi: 10.1002/pmic.201200330. Epub 2012 Dec 23. Proteomics. 2013. PMID: 23184572 Free PMC article. - Large-scale motions in the adenylate kinase solution ensemble: coarse-grained simulations and comparison with solution X-ray scattering.
Daily MD, Makowski L, Phillips GN Jr, Cui Q. Daily MD, et al. Chem Phys. 2012 Mar 2;396:84-91. doi: 10.1016/j.chemphys.2011.08.015. Chem Phys. 2012. PMID: 22711968 Free PMC article. - Hydration dynamics and IR spectroscopy of 4-fluorophenol.
Salehi SM, Käser S, Töpfer K, Diamantis P, Pfister R, Hamm P, Rothlisberger U, Meuwly M. Salehi SM, et al. Phys Chem Chem Phys. 2022 Nov 2;24(42):26046-26060. doi: 10.1039/d2cp02857c. Phys Chem Chem Phys. 2022. PMID: 36268728 Free PMC article. - On the relationship between NMR-derived amide order parameters and protein backbone entropy changes.
Sharp KA, O'Brien E, Kasinath V, Wand AJ. Sharp KA, et al. Proteins. 2015 May;83(5):922-30. doi: 10.1002/prot.24789. Epub 2015 Mar 25. Proteins. 2015. PMID: 25739366 Free PMC article.
References
- Alder BJ, Wainwright TE. J Chem Phys. 1957;27:1208.
- Rahman A. Phys Rev. 1964;136:405–406.
- Rahman A, Stillinger FH. J Chem Phys. 1971;55:3336–3359.
- McCammon JA, Gelin BR, Karplus M. Nature. 1977;267:585–590. - PubMed
- Hockney RW, Eastwood JW. Computer Simulation Using Particles. McGraw-Hill; New York: 1981.
Publication types
MeSH terms
Substances
Grants and funding
- R01 GM030804-29/GM/NIGMS NIH HHS/United States
- RR023920/RR/NCRR NIH HHS/United States
- R01 GM030804-30/GM/NIGMS NIH HHS/United States
- R01 GM030804-35/GM/NIGMS NIH HHS/United States
- R01 RR023920-02/RR/NCRR NIH HHS/United States
- R01 GM030804-33/GM/NIGMS NIH HHS/United States
- R01 GM030804-32/GM/NIGMS NIH HHS/United States
- R01 RR023920/RR/NCRR NIH HHS/United States
- Z01 HL001051-10/ImNIH/Intramural NIH HHS/United States
- R01 GM030804-31/GM/NIGMS NIH HHS/United States
- R01 GM030804-34/GM/NIGMS NIH HHS/United States
- R01 GM082209/GM/NIGMS NIH HHS/United States
- R01 GM030804-38/GM/NIGMS NIH HHS/United States
- F32 GM083422/GM/NIGMS NIH HHS/United States
- R01 GM065418/GM/NIGMS NIH HHS/United States
- R01 GM030804-39/GM/NIGMS NIH HHS/United States
- Z01 HL001052-10/ImNIH/Intramural NIH HHS/United States
- R01 GM030804-37/GM/NIGMS NIH HHS/United States
- R01 GM030804-36/GM/NIGMS NIH HHS/United States
LinkOut - more resources
Full Text Sources
Other Literature Sources
