A single-array preprocessing method for estimating full-resolution raw copy numbers from all Affymetrix genotyping arrays including GenomeWideSNP 5 & 6 - PubMed (original) (raw)
A single-array preprocessing method for estimating full-resolution raw copy numbers from all Affymetrix genotyping arrays including GenomeWideSNP 5 & 6
Henrik Bengtsson et al. Bioinformatics. 2009.
Abstract
Motivation: High-resolution copy-number (CN) analysis has in recent years gained much attention, not only for the purpose of identifying CN aberrations associated with a certain phenotype, but also for identifying CN polymorphisms. In order for such studies to be successful and cost effective, the statistical methods have to be optimized. We propose a single-array preprocessing method for estimating full-resolution total CNs. It is applicable to all Affymetrix genotyping arrays, including the recent ones that also contain non-polymorphic probes. A reference signal is only needed at the last step when calculating relative CNs.
Results: As with our method for earlier generations of arrays, this one controls for allelic crosstalk, probe affinities and PCR fragment-length effects. Additionally, it also corrects for probe sequence effects and co-hybridization of fragments digested by multiple enzymes that takes place on the latest chips. We compare our method with Affymetrix's CN5 method and the dChip method by assessing how well they differentiate between various CN states at the full resolution and various amounts of smoothing. Although CRMA v2 is a single-array method, we observe that it performs as well as or better than alternative methods that use data from all arrays for their preprocessing. This shows that it is possible to do online analysis in large-scale projects where additional arrays are introduced over time.
Figures
Fig. 1.
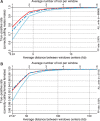
ROC curves showing that CRMA v2 (solid red) separates CN = 1 from CN = 2 (ChrX) better than CN5 (dashed blue) and dChip* (solid light blue) at the full resolution (H = 1; A) as well as at various amounts of smoothing (H = 1, 2, 3, 4; B). The curves for H = 1 are in the lower right corner and the curves for H = 4 are in the upper left corner.
Fig. 2.
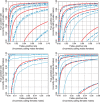
The true-positive rate as a function of resolution/smoothing at a 2.0% false-positive rate for the different methods. The results for the CN = 2 versus CN = 1 (ChrX) test is depicted in (A) and the results for the CN = 1 versus CN = 0 (ChrY) test in (B). Note the different scales. See Figure 1 for legends.
Fig. 3.
ROC curves showing CRMA v2 differentiates between CN = 1 and CN = 0 (ChrY) as well as or slightly worse than CN5, and better than dChip* at the full resolution (A) as well as at various amounts of smoothing (B). See Figure 1 for legends.
Fig. 4.
The methods' performances on SNPs (left) and CN units (right) when testing for CN = 2 versus CN = 1 (ChrX; upper) and CN = 1 versus CN = 0 (ChrY; lower). The panels show the ROC curves for CRMA v2 (solid red), CN5 (dashed blue) and dChip* (solid light blue) at H = 1, 2, 3, 4 amounts of smoothing.
Fig. 5.
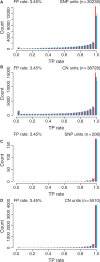
Distribution of true-positive rates for SNPs (A and C) and CN units (B and D) for CRMA v2 (left bars; red), CN5 (middle bars; blue) and dChip* (right bars; light blue) when testing for CN = 2 versus CN = 1 (ChrX; A and B) and CN = 1 versus CN = 0 (ChrY; C and D) while fixing the false-positive rate (3.45%). No smoothing was applied.
Fig. 6.
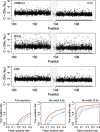
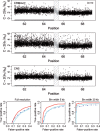
The region 100.1–107.5 Mb on Chr 1 in tumor-normal sample HCC1143 has a change point at ∼103.8 Mb, which separates a copy-neutral state (left) from a loss (right). There are 2242 and 2074 loci in these two states, respectively (totaling 4316 loci). The top three rows show the raw CNs [Equation (14)] of the CRMA v2, the dChip and the CN5 methods, respectively. The 500 kb safety region around the change point with data points excluded in the evaluation is highlighted by a dashed frame. The three panels in the bottom row show the ROC performance of the three methods at the full resolution, and after binning the CNs in non-overlapping windows of size 5 and 20 kb, respectively. See Figure 4 for legends.
Fig. 7.
The region 61.0–69.0Mb on Chr 10 in tumor-normal sample HCC1143 has a change point at ∼65.3 Mb, which separates a gain (left) from a copy-neutral state (right). There are 2805 and 2480 loci in these two states, respectively (totaling 5285 loci). See Figure 6 for content and legends as in.
Similar articles
- Estimation and assessment of raw copy numbers at the single locus level.
Bengtsson H, Irizarry R, Carvalho B, Speed TP. Bengtsson H, et al. Bioinformatics. 2008 Mar 15;24(6):759-67. doi: 10.1093/bioinformatics/btn016. Epub 2008 Jan 19. Bioinformatics. 2008. PMID: 18204055 - TumorBoost: normalization of allele-specific tumor copy numbers from a single pair of tumor-normal genotyping microarrays.
Bengtsson H, Neuvial P, Speed TP. Bengtsson H, et al. BMC Bioinformatics. 2010 May 12;11:245. doi: 10.1186/1471-2105-11-245. BMC Bioinformatics. 2010. PMID: 20462408 Free PMC article. - ACNE: a summarization method to estimate allele-specific copy numbers for Affymetrix SNP arrays.
Ortiz-Estevez M, Bengtsson H, Rubio A. Ortiz-Estevez M, et al. Bioinformatics. 2010 Aug 1;26(15):1827-33. doi: 10.1093/bioinformatics/btq300. Epub 2010 Jun 6. Bioinformatics. 2010. PMID: 20529889 Free PMC article. - CNV discovery using SNP genotyping arrays.
Yau C, Holmes CC. Yau C, et al. Cytogenet Genome Res. 2008;123(1-4):307-12. doi: 10.1159/000184722. Epub 2009 Mar 11. Cytogenet Genome Res. 2008. PMID: 19287169 Review. - Strategies for the detection of copy number and other structural variants in the human genome.
Carson AR, Feuk L, Mohammed M, Scherer SW. Carson AR, et al. Hum Genomics. 2006 Jun;2(6):403-14. doi: 10.1186/1479-7364-2-6-403. Hum Genomics. 2006. PMID: 16848978 Free PMC article. Review.
Cited by
- Frequent copy number variants in a cohort of Mexican-Mestizo individuals.
Sánchez S, Juárez U, Domínguez J, Molina B, Barrientos R, Martínez-Hernández A, Carnevale A, Grether-González P, Mayen DG, Villarroel C, Lieberman E, Yokoyama E, Del Castillo V, Torres L, Frias S. Sánchez S, et al. Mol Cytogenet. 2023 Jan 12;16(1):2. doi: 10.1186/s13039-022-00631-z. Mol Cytogenet. 2023. PMID: 36631885 Free PMC article. - Deletions in VANGL1 are a risk factor for antibody-mediated kidney disease.
Jiang SH, Mercan S, Papa I, Moldovan M, Walters GD, Koina M, Fadia M, Stanley M, Lea-Henry T, Cook A, Ellyard J, McMorran B, Sundaram M, Thomson R, Canete PF, Hoy W, Hutton H, Srivastava M, McKeon K, de la Rúa Figueroa I, Cervera R, Faria R, D'Alfonso S, Gatto M, Athanasopoulos V, Field M, Mathews J, Cho E, Andrews TD, Kitching AR, Cook MC, Riquelme MA, Bahlo M, Vinuesa CG. Jiang SH, et al. Cell Rep Med. 2021 Dec 21;2(12):100475. doi: 10.1016/j.xcrm.2021.100475. eCollection 2021 Dec 21. Cell Rep Med. 2021. PMID: 35028616 Free PMC article. - A genome-wide scan to locate regions associated with familial vesicoureteral reflux.
Bartik Z, Sillén U, Östensson M, Fransson S, Djos A, Sjöberg R, Martinsson T. Bartik Z, et al. Exp Ther Med. 2022 Jan;23(1):92. doi: 10.3892/etm.2021.11015. Epub 2021 Nov 28. Exp Ther Med. 2022. PMID: 34976134 Free PMC article. - A family study implicates GBE1 in the etiology of autism spectrum disorder.
Fanjul-Fernández M, Brown NJ, Hickey P, Diakumis P, Rafehi H, Bozaoglu K, Green CC, Rattray A, Young S, Alhuzaimi D, Mountford HS, Gillies G, Lukic V, Vick T, Finlay K, Coe BP, Eichler EE, Delatycki MB, Wilson SJ, Bahlo M, Scheffer IE, Lockhart PJ. Fanjul-Fernández M, et al. Hum Mutat. 2022 Jan;43(1):16-29. doi: 10.1002/humu.24289. Epub 2021 Oct 21. Hum Mutat. 2022. PMID: 34633740 Free PMC article. - Dissecting the heterogeneity of the alternative polyadenylation profiles in triple-negative breast cancers.
Wang L, Lang GT, Xue MZ, Yang L, Chen L, Yao L, Li XG, Wang P, Hu X, Shao ZM. Wang L, et al. Theranostics. 2020 Aug 21;10(23):10531-10547. doi: 10.7150/thno.40944. eCollection 2020. Theranostics. 2020. PMID: 32929364 Free PMC article.
References
- Affymetrix Inc. Genome-Wide Human SNP Nsp/Sty 6.0 User Guide. 2007a Affymetrix Inc. Rev 1. Available at http://www.affymetrix.com/
- Affymetrix Inc. Genome-Wide Human SNP Nsp/Sty Assay 5.0. 2007b Affymetrix Inc. Rev 2. Available at http://www.affymetrix.com/
- Affymetrix Inc. Affymetrix Genotyping Console 3.0 - User Manual. 2008 Affymetrix Inc. Available at http://www.affymetrix.com/
Publication types
MeSH terms
LinkOut - more resources
Full Text Sources
Other Literature Sources
Research Materials

