Impaired balance of mitochondrial fission and fusion in Alzheimer's disease - PubMed (original) (raw)
Impaired balance of mitochondrial fission and fusion in Alzheimer's disease
Xinglong Wang et al. J Neurosci. 2009.
Abstract
Mitochondrial dysfunction is a prominent feature of Alzheimer's disease (AD) neurons. In this study, we explored the involvement of an abnormal mitochondrial dynamics by investigating the changes in the expression of mitochondrial fission and fusion proteins in AD brain and the potential cause and consequence of these changes in neuronal cells. We found that mitochondria were redistributed away from axons in the pyramidal neurons of AD brain. Immunoblot analysis revealed that levels of DLP1 (also referred to as Drp1), OPA1, Mfn1, and Mfn2 were significantly reduced whereas levels of Fis1 were significantly increased in AD. Despite their differential effects on mitochondrial morphology, manipulations of these mitochondrial fission and fusion proteins in neuronal cells to mimic their expressional changes in AD caused a similar abnormal mitochondrial distribution pattern, such that mitochondrial density was reduced in the cell periphery of M17 cells or neuronal process of primary neurons and correlated with reduced spine density in the neurite. Interestingly, oligomeric amyloid-beta-derived diffusible ligands (ADDLs) caused mitochondrial fragmentation and reduced mitochondrial density in neuronal processes. More importantly, ADDL-induced synaptic change (i.e., loss of dendritic spine and postsynaptic density protein 95 puncta) correlated with abnormal mitochondrial distribution. DLP1 overexpression, likely through repopulation of neuronal processes with mitochondria, prevented ADDL-induced synaptic loss, suggesting that abnormal mitochondrial dynamics plays an important role in ADDL-induced synaptic abnormalities. Based on these findings, we suggest that an altered balance in mitochondrial fission and fusion is likely an important mechanism leading to mitochondrial and neuronal dysfunction in AD brain.
Figures
Figure 1.
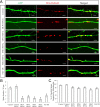
Mitochondrial fission and fusion protein expression and distribution in AD hippocampus. A, B, Representative immunoblot (A) and quantification (B) analysis revealed that in AD hippocampus (n = 13), levels of DLP1/OPA1/Mfn1/Mfn2 were reduced significantly, whereas levels of Fis1 were increased significantly compared with age-matched controls (n = 12) (*p < 0.05, Student's _t_ test). Equal protein amounts (30 μg) were loaded and confirmed with actin staining (**_A_**). **_C_**, Representative immunocytochemistry of DLP1, OPA1, Mfn1, Mfn2, and Fis1 in hippocampus from AD (right) and age-matched controls (left). Scale bars, 50 μm. **_D_**, Positively stained neurons were categorized into three groups: neurons with soma staining only, neurons with axon staining only, and neurons with both axon and soma staining. Quantification in five AD brains and five age-matched controls indicated that Fis1, OPA1, Mfn1, and Mfn2 demonstrated soma staining in >80% of pyramidal neurons in AD hippocampus, significantly different from what was seen for control hippocampal neurons.
Figure 2.
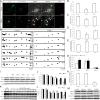
Altered distribution of mitochondria in AD. A, Representative immunocytochemistry of COX I confirmed that in AD hippocampus, COX I staining of neuronal processes was significantly reduced compared with age-matched controls (*p < 0.05, Student's t test). B, A representative immunoelectron micrograph of COX I gold labeling of mitochondria is shown. C, A representative immunofluorescence picture of COX I staining (green) and tubulin (red) in AD hippocampus (bottom) and age-matched control (top). D, Quantification revealed that mitochondria were evenly distributed in the control (n = 5), whereas they were significantly constricted in the soma in AD hippocampus (n = 5) (*p < 0.05, Student's t test).
Figure 3.
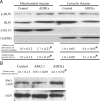
Changes in subcellular localization and modification of DLP1 in AD brain. A, Representative immunoblot and quantification analysis of DLP1 and phospho-DLP1 (Ser616) (p-DLP1) in the mitochondrial and cytosolic fraction from AD brains (n = 8) and age-matched control brains (n = 8) indicated that, although relative mitochondrial DLP1 level (DLP1/COX IV) did not change significantly, the relative ratio of p-DLP1 to DLP1 increased significantly in both mitochondrial and cytosolic fractions from AD brain samples. All samples were also immunoblotted with antibodies to detect mitochondrial (COX IV) and cytoplasmic (GAPDH) markers. The absence of GAPDH in the mitochondrial fraction confirms the purity of preparations from brain tissues. B, Representative immunoblot and quantification analysis of _S_-nitrosylated DLP1 (SNO-DLP1) by biotin-switch assay of AD brains (n = 8) and age-matched control brains (n = 8) showed that relative SNO-DLP1 formation increased significantly in AD. All experiments were repeated three times (*p < 0.05, Student's t test).
Figure 4.
Modulations of mitochondrial fission/fusion proteins, mimicking changes in AD neurons, cause abnormal mitochondrial distribution in M17 cells. A, Representative immunoblot analysis of M17 cells stably knocking down or overexpressing mitochondrial fission and fusion proteins. Equal protein amounts (15 μg) were loaded. Tubulin immunoblot was used as an internal loading control. B, Representative confocal pictures of mitochondria in M17 cells either stably overexpressing (OE) or knocking down (RNAi) mitochondrial fission/fusion proteins. Cells were transfected with Mito-DsRed2 to label mitochondria. For knockdown experiments, GFP was tagged to the micro-RNAi construct. For overexpression experiments, tubulin was immunostained as green to label the cell shape. C, D, Quantifications of mitochondrial morphology (C) and abnormal distribution (D) in M17 cell either stably overexpressing or knocking down mitochondrial fission/fusion proteins revealed differential effects on mitochondrial morphology but similar effects on abnormal mitochondrial distribution for those manipulations mimicking changes in AD. Scale bars, 20 μm. At least 500 cells were analyzed in triplicate for each cell line (*p < 0.05, Student's t test).
Figure 5.
Modulations of mitochondrial fission/fusion proteins, mimicking changes in AD, cause similar abnormalities in differentiated primary neuronal cells. A, Representative pictures of mitochondria in primary rat E18 hippocampal neurons (DIV 7–12) transiently transfected with GFP-tagged miR RNAi expression vector targeting DLP1, OPA1, Mfn1, or Mfn2 (DLP1, OPA1, Mfn1, or Mfn2 RNAi) or a Myc-tagged Fis1 expression vector (Fis1 OE) and Mito-DsRed2 (Red) to label mitochondria. For Myc-tagged Fis1 overexpression, a GFP-expressing vector was also cotransfected to show neurites and soma. Positively transfected cells were identified by GFP fluorescence (green) or Myc immunostaining (white). B–E, Quantification of mitochondrial length (B), number (C), neurite mitochondrial index (total mitochondrial length/neurite length) (D), and axial length of neurites devoid of mitochondria (E) in a segment of neuronal process 400 μm in length beginning from the cell body of neurons either overexpressing or knocking down mitochondrial fission/fusion proteins (*p < 0.05, Student's t test). Scale bars, 20 μm. At least 20 cells were analyzed in each experiment, and experiments were repeated three times.
Figure 6.
Effect of mitochondrial fission/fusion proteins on dendritic spines. Primary rat E18 primary hippocampal neurons were transfected at DIV 9 with the indicated plasmids. For each neuron, dendritic segments of 100–200 μm in length beginning 100 μm from the cell body were selected. A, Representative pictures of positively transfected neurons are shown. B, C, Quantification of spine number and the percentage of spines supported by mitochondria (*p < 0.05, Student's t test). Scale bars, 5 μm. At least 20 cells were analyzed in each experiment, and experiments were repeated three times.
Figure 7.
Effects of ADDLs on mitochondrial morphology and distribution in primary neurons. Primary rat E18 hippocampal neurons (DIV 9–12) transfected with GFP and Mito-DsRed2 were treated with 800 n
m
ADDLs for 24 h. Twenty-four hours of treatment of Aβ42-1, subject to the same procedure that produces ADDLs, was used as a control. A, Representative pictures of positively transfected neurons. Red, DsRed; green, GFP; white: tubulin staining. B–E, Quantification of mitochondrial length (B), density (C), neurite mitochondrial index (D), and axial length of neurites devoid of mitochondria (E) in a segment of neuronal process 400 μm in length beginning from the cell body of neurons (*p < 0.05, Student's t test). At least 20 cells were analyzed in each experiment, experiments were repeated three times. F, Demonstration of the effect of ADDLs on mitochondrial fission and fusion events. Rat E18 hippocampal neurons (DIV 9) were transfected with Mito-DsRed2. Twenty-four hours after incubation with or without 800 n
m
ADDLs at DIV 11, neurons were imaged in time lapse (10 s interval, 20 min). Representative thresholded time-lapse pictures showed active mitochondrial fission and fusion in the segment of axon ∼100 μm in length beginning 300 μm from the cell body of control or ADDL-treated neurons. Active mitochondrial fission (filled arrows) and fusion (empty arrows) and fast-moving mitochondria (asterisks) are marked. G, H, Both fusion and fission were impaired significantly by ADDLs (G), and mitochondria spent significantly less time in the post-fusion fused state than in the post-fission single state (H). At least 20 neurons were analyzed in three independent experiments (*p < 0.05, Student's t test). I–L, Immunoblot and quantitative analysis of DLP1 and OPA1 levels in neurons treated at the indicated dosages of ADDLs for 24 h (I, J) or at 800 n
m
for the indicated periods of time (K, L) revealed that ADDLs induced a dose- and time-dependent decrease in DLP1 and OPA1 levels (*p < 0 0.05, Student's t test). C, Control, UNT, untreated. M, Unlike ADDLs, 10 μ
m
Aβ42-1 had no effect on the expression of DLP1 and OPA1. Equal protein amounts (15 μg) were loaded. Actin immunoblot was used as an internal loading control.
Figure 8.
Effects of ADDLs on subcellular localization and modification of DLP1 in primary rat E18 hippocampal neurons. A, Representative immunoblot and quantification analysis showed that both relative mitochondrial DLP1 level (DLP1/COX IV) and the relative ratio of phospho-DLP1 (p-DLP1) to DLP1 increased significantly in primary rat E18 hippocampal neurons (DIV 12) treated with 800 n
m
ADDLs for 24 h. Unlike ADDLs, 10 μ
m
Aβ42-1 had no effect on either relative mitochondrial DLP1 level (DLP1/COX IV) or the relative ratio of p-DLP1/DLP1 (not shown). All samples were also immunoblotted with antibodies to detect mitochondrial (COX IV) and cytoplasmic (GAPDH) markers. The absence of GAPDH in the mitochondrial fraction confirms the purity of preparations from cell lysates. B, Representative immunoblot and quantification analysis further revealed that _S_-nitrosylated DLP1 (SNO-DLP1) formation was also enhanced in primary rat E18 hippocampal neurons (DIV 12) treated with 800 n
m
ADDLs for 24 h. As a control, 10 μ
m
Aβ42-1 did not affect SNO-DLP1 formation. All experiments were repeated three times (*p < 0.05, Student's t test).
Figure 9.
Effects of DLP1 and OPA1 on ADDL-induced mitochondrial dynamics changes. A, Representative pictures of neurons (DIV 12) cotransfected with GFP-, Mito-DsRed2-, and Myc-tagged wild-type DLP1 or wild-type OPA1 after 24 h treatment with 800 n
m
ADDLs. Areas enclosed in white boxes are shown at higher magnification in Inset panels (right) to allow better appreciation of changes in mitochondrial morphology and density. Red, DsRed; green, Myc; white, Tubulin staining. B–E, Quantification of mitochondrial number (B), length (C), neurite mitochondrial index (D), and axial length of neurites not covered by mitochondria (E) in neurons with indicated treatment or manipulation (*p < 0.05, when compared with the nontransfected or empty vector-transfected normal control cells; #p < 0.05, when compared with control or empty vector-transfected cells with ADDL treatment; Student's t test). At least 20 neurons were analyzed in three independent experiments. UNT, Untreated.
Figure 10.
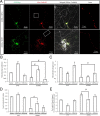
Effects of DLP1 and OPA1 on ADDL-induced changes in mitochondrial function and neuronal function. A, B, Representative fluorescent pictures and quantification of mitochondrial ROS in neurons (DIV 12) transfected with GFP-tagged wild-type DLP1 or wild-type OPA1 with or without ADDL treatment. Mitochondrial ROS was labeled by MitoSOX; Positive transfected cells were selected by GFP signal. C, D, Representative pictures and quantification of dendritic spine in neurons with or without ADDL treatment. Neurons (DIV 9) were cotransfected with GFP- and Myc-tagged wild-type DLP1 or OPA1. Positive transfected cells were selected on the basis of GFP and Myc staining. E, F, To study the effect of Aβ on PSD-95, neurons (DIV 9) were cotransfected with YFP-tagged PSD-95 to label excitatory synapses, Mito-DsRed2 to label mitochondria, and Myc-tagged DLP1 or OPA1 constructs. Shown are representative pictures and quantification of PSD-95 puncta in neurons with or without ADDL treatment and manipulation. Red, DsRed; green, YFP; blue, MAP2A. Scale bars, 5 μm. At least 20 neurons were analyzed in three independent experiments (*p < 0.05, when compared with the nontransfected or empty vector-transfected normal control cells; #p < 0.05, when compared with control or empty vector-transfected cells with ADDL treatment; Student's t test).
Similar articles
- Impaired mitochondrial dynamics and abnormal interaction of amyloid beta with mitochondrial protein Drp1 in neurons from patients with Alzheimer's disease: implications for neuronal damage.
Manczak M, Calkins MJ, Reddy PH. Manczak M, et al. Hum Mol Genet. 2011 Jul 1;20(13):2495-509. doi: 10.1093/hmg/ddr139. Epub 2011 Mar 31. Hum Mol Genet. 2011. PMID: 21459773 Free PMC article. - Inhibition of ERK-DLP1 signaling and mitochondrial division alleviates mitochondrial dysfunction in Alzheimer's disease cybrid cell.
Gan X, Huang S, Wu L, Wang Y, Hu G, Li G, Zhang H, Yu H, Swerdlow RH, Chen JX, Yan SS. Gan X, et al. Biochim Biophys Acta. 2014 Feb;1842(2):220-31. doi: 10.1016/j.bbadis.2013.11.009. Epub 2013 Nov 16. Biochim Biophys Acta. 2014. PMID: 24252614 Free PMC article. - Amyloid-beta overproduction causes abnormal mitochondrial dynamics via differential modulation of mitochondrial fission/fusion proteins.
Wang X, Su B, Siedlak SL, Moreira PI, Fujioka H, Wang Y, Casadesus G, Zhu X. Wang X, et al. Proc Natl Acad Sci U S A. 2008 Dec 9;105(49):19318-23. doi: 10.1073/pnas.0804871105. Epub 2008 Dec 2. Proc Natl Acad Sci U S A. 2008. PMID: 19050078 Free PMC article. - Multiple faces of dynamin-related protein 1 and its role in Alzheimer's disease pathogenesis.
Kandimalla R, Reddy PH. Kandimalla R, et al. Biochim Biophys Acta. 2016 Apr;1862(4):814-828. doi: 10.1016/j.bbadis.2015.12.018. Epub 2015 Dec 17. Biochim Biophys Acta. 2016. PMID: 26708942 Free PMC article. Review. - Dynamin-related protein 1 and mitochondrial fragmentation in neurodegenerative diseases.
Reddy PH, Reddy TP, Manczak M, Calkins MJ, Shirendeb U, Mao P. Reddy PH, et al. Brain Res Rev. 2011 Jun 24;67(1-2):103-18. doi: 10.1016/j.brainresrev.2010.11.004. Epub 2010 Dec 8. Brain Res Rev. 2011. PMID: 21145355 Free PMC article. Review.
Cited by
- Molecular Motors in Myelination and Their Misregulation in Disease.
Barbosa DJ, Carvalho C, Costa I, Silva R. Barbosa DJ, et al. Mol Neurobiol. 2024 Oct 31. doi: 10.1007/s12035-024-04576-9. Online ahead of print. Mol Neurobiol. 2024. PMID: 39477877 Review. - Decoding Cancer through Silencing the Mitochondrial Gatekeeper VDAC1.
Arif T, Shteinfer-Kuzmine A, Shoshan-Barmatz V. Arif T, et al. Biomolecules. 2024 Oct 15;14(10):1304. doi: 10.3390/biom14101304. Biomolecules. 2024. PMID: 39456237 Free PMC article. Review. - Mitochondrion-based organellar therapies for central nervous system diseases.
Zhao M, Wang J, Zhu S, Wang M, Chen C, Wang L, Liu J. Zhao M, et al. Cell Commun Signal. 2024 Oct 10;22(1):487. doi: 10.1186/s12964-024-01843-z. Cell Commun Signal. 2024. PMID: 39390521 Free PMC article. Review. - New Insights into Mitochondria in Health and Diseases.
Li Y, Zhang H, Yu C, Dong X, Yang F, Wang M, Wen Z, Su M, Li B, Yang L. Li Y, et al. Int J Mol Sci. 2024 Sep 16;25(18):9975. doi: 10.3390/ijms25189975. Int J Mol Sci. 2024. PMID: 39337461 Free PMC article. Review.
References
- Almeida CG, Tampellini D, Takahashi RH, Greengard P, Lin MT, Snyder EM, Gouras GK. Beta-amyloid accumulation in APP mutant neurons reduces PSD-95 and GluR1 in synapses. Neurobiol Dis. 2005;20:187–198. - PubMed
- Barsoum MJ, Yuan H, Gerencser AA, Liot G, Kushnareva Y, Gräber S, Kovacs I, Lee WD, Waggoner J, Cui J, White AD, Bossy B, Martinou JC, Youle RJ, Lipton SA, Ellisman MH, Perkins GA, Bossy-Wetzel E. Nitric oxide-induced mitochondrial fission is regulated by dynamin-related GTPases in neurons. EMBO J. 2006;25:3900–3911. - PMC - PubMed
- Benard G, Bellance N, James D, Parrone P, Fernandez H, Letellier T, Rossignol R. Mitochondrial bioenergetics and structural network organization. J Cell Sci. 2007;120:838–848. - PubMed
- Blass JP, Sheu RK, Gibson GE. Inherent abnormalities in energy metabolism in Alzheimer disease. Interaction with cerebrovascular compromise. Ann N Y Acad Sci. 2000;903:204–221. - PubMed
- Bubber P, Haroutunian V, Fisch G, Blass JP, Gibson GE. Mitochondrial abnormalities in Alzheimer brain: mechanistic implications. Ann Neurol. 2005;57:695–703. - PubMed
Publication types
MeSH terms
Substances
LinkOut - more resources
Full Text Sources
Other Literature Sources
Medical
Molecular Biology Databases
Miscellaneous


