Identifying currents in the gene pool for bacterial populations using an integrative approach - PubMed (original) (raw)
Identifying currents in the gene pool for bacterial populations using an integrative approach
Jing Tang et al. PLoS Comput Biol. 2009 Aug.
Abstract
The evolution of bacterial populations has recently become considerably better understood due to large-scale sequencing of population samples. It has become clear that DNA sequences from a multitude of genes, as well as a broad sample coverage of a target population, are needed to obtain a relatively unbiased view of its genetic structure and the patterns of ancestry connected to the strains. However, the traditional statistical methods for evolutionary inference, such as phylogenetic analysis, are associated with several difficulties under such an extensive sampling scenario, in particular when a considerable amount of recombination is anticipated to have taken place. To meet the needs of large-scale analyses of population structure for bacteria, we introduce here several statistical tools for the detection and representation of recombination between populations. Also, we introduce a model-based description of the shape of a population in sequence space, in terms of its molecular variability and affinity towards other populations. Extensive real data from the genus Neisseria are utilized to demonstrate the potential of an approach where these population genetic tools are combined with an phylogenetic analysis. The statistical tools introduced here are freely available in BAPS 5.2 software, which can be downloaded from http://web.abo.fi/fak/mnf/mate/jc/software/baps.html.
Conflict of interest statement
The authors have declared that no competing interests exist.
Figures
Figure 1. Graphical representation of the evolutionary model for a sample of two bacterial populations.
Strain sequences are represented as vertical bars with horizontal lines indicating the mutations that have occurred since the global ancestor. Stage-1 mutations are defined as those that occurred on local ancestors which provide candidate sites for gene flow between the populations. Mutations that occurred after the local ancestors are referred to as stage-2 mutations.
Figure 2. Tentative gene flow graph in six populations.
The graph topology can be succinctly termed as  , where the node set
  and the arrow set
  . The actual rates of admixture associated with the arrows were randomly generated from a uniform distribution. Note the two ways of gene flow between population 2 and 3.
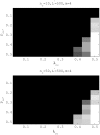
Figure 3. Testing partition accuracy for different choices of gene flow weights for a small population size (upper panel) and a large population size (lower panel).
The number of segregating sites for both settings is  and the ratio of mutations at two stages is
  . Data were generated by assigning
  and
and  randomly at the interval [0,1] with the gene flow topology fixed as in Figure 2. A brighter area corresponds to a range of
  and
and  , within which the true partition has been identified by BAPS with a higher accuracy as measured by Rand Index (RI).
Figure 4. Testing gene flow structure accuracy for and .
Graph similarity was measured in the Hamming distance coded in a gray-scale image. Cells with the paper white color represent the scenarios where the partition and the gene flow structure in Figure 2 are both correctly identified by BAPS.
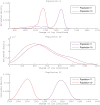
Figure 5. Genetic shapes of five populations relative to population 2.
The data set was generated with  ,
,  ,
,  and Figure 2 as the underlying population structure. Each curve is a density estimation of (8) using (9) for one target population.
Figure 6. Bootstrap mixture analyses of the Neisseria data.
The figure shows the adjusted rand index between the partition based on the original data and the alternative based on a bootstrap data set by resampling in  clusters. Five repetitions were made for each of the
  clusters.
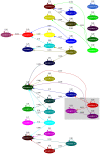
Figure 7. Gene flow network identified in the N. meningitidis and N. lactamica populations.
To investigate the ancestral admixture of a certain population, one can look at all the arrows pointing at this population. A typical population contains the major sources of its own, denoted as a self-looping arrows, and small proportions of gene flow from other populations. For instance, population 29 has 73% of its own genetic makeup and 27% of the DNA introduced via gene flow from other populations. Two major sources of gene flow for population 29 are population 19 and population 11, with 3.3% and 6.9% in the contribution separately. The remaining 17.1% of genes comes from various sources while none of them contributes a proportion larger than 3% and therefore are not displayed due to the pruning.
Figure 8. Genetic shapes of N. lactamica populations 8, 29 and 32 as relative to N. meningitidis populations 11 and 19.
Figure 9. The first NJ tree.
It shows a subset of the BAPS populations indicated with distinct colors.
Figure 10. The second NJ tree.
Figure 11. The third NJ tree.
Figure 12. The fourth NJ tree.
Figure 13. Color coding scheme used in the BAPS populations and the NJ trees.
For example, the first row shows the BAPS populations highlighted in the first NJ tree in Figure 9.
References
- Feil EJ, Spratt BG. Recombination and the population structures of bacterial pathogens. Annu Rev Microbiol. 2001;55:561–590. - PubMed
- Hartl D, Clark AG. Principles of Population Genetics, Fourth edition. Sunderland, MA: Sinauer Associates; 2007.
- Whitaker RJ, Grogan DW, Taylor JW. Geographic barriers isolate endemic populations of hyperthermophilic archaea. Science. 2003;301:976–978. - PubMed
Publication types
MeSH terms
LinkOut - more resources
Full Text Sources
Miscellaneous


