The dynamin-related GTPase Drp1 is required for embryonic and brain development in mice - PubMed (original) (raw)
The dynamin-related GTPase Drp1 is required for embryonic and brain development in mice
Junko Wakabayashi et al. J Cell Biol. 2009.
Abstract
The dynamin-related guanosine triphosphatase Drp1 mediates the division of mitochondria and peroxisomes. To understand the in vivo function of Drp1, complete and tissue-specific mouse knockouts of Drp1 were generated. Drp1-null mice die by embryonic day 11.5. This embryonic lethality is not likely caused by gross energy deprivation, as Drp1-null cells showed normal intracellular adenosine triphosphate levels. In support of the role of Drp1 in organelle division, mitochondria formed extensive networks, and peroxisomes were elongated in Drp1-null embryonic fibroblasts. Brain-specific Drp1 ablation caused developmental defects of the cerebellum in which Purkinje cells contained few giant mitochondria instead of the many short tubular mitochondria observed in control cells. In addition, Drp1-null embryos failed to undergo developmentally regulated apoptosis during neural tube formation in vivo. However, Drp1-null embryonic fibroblasts have normal responses to apoptotic stimuli in vitro, suggesting that the apoptotic function of Drp1 depends on physiological cues. These findings clearly demonstrate the physiological importance of Drp1-mediated organelle division in mice.
Figures
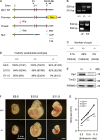
Figure 1.
Drp1 is required for embryonic mouse development. (A) Design of Drp1 knockout alleles. WT, wild type. (B) Confirmation of knockout by PCR. Genomic DNAs were prepared from embryos, yolk sack, or tails of adult mice for PCR. To distinguish Drp1+/+, Drp1+/−, and Drp1−/−, D1, D3, and D5 were used. Wild-type and null alleles produced 315-bp and 539-bp PCR products, respectively. For floxed alleles, D3 and D6 were used. Wild-type (+) and floxed (F) alleles generated 355-bp and 532-bp PCR products, respectively. (C) Genotypes of offspring from breeding of Drp1+/− mice. (D) Number of viable embryos. (E) Immunoblotting of embryos. (F) Images of embryos. (G) Crown rump length of embryos. ***, P < 0.001 (n ≥ 14).
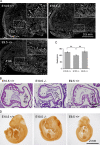
Figure 2.
Characterization of Drp1−/− embryos. (A) DAPI-stained sections of placenta of age-matched E10.5 Drp1+/+ and Drp1−/− embryos and an E9.5 Drp1+/+ embryo, which was size matched to the E10.5 Drp1−/− embryos. Insets show enlarged images of boxed regions. Trophoblast giant cell (TGC) and labyrinth (L) layers are indicated. (B) H&E stains of sagittal sections of embryonic heart. (C) Beat rates in isolated embryonic cardiomyocytes were measured using differential interference contrast microscopy. (D) Whole-mount immunohistochemistry of embryos with anti-PECAM antibodies. **, P < 0.01 (n ≥ 39). Error bars indicate mean ± SEM.
Figure 3.
Characterization of Drp1−/− MEFs. (A) MEFs were immunostained with anti-Tom20 antibodies. (B) Quantitation of MEFs with netlike mitochondria (n ≥ 3; >100 cells/experiment). (C) Drp1−/− MEFs carrying pTracer-EF/Bsd (control; Invitrogen) and pTracer-EF/Bsd-Drp1 were stained with MitoTracker (Invitrogen). (D) Frames from time-lapse confocal microscopy (
Videos 1
and
2
). Arrowheads indicate mitochondrial division, and arrows show extension and retraction of mitochondrial tubules. (E and F) Quantitation of mitochondrial division (E) and extension (F; n ≥ 8). (G) EM of mitochondria in MEFs. (H) Peroxisomal morphology. MEFs were immunostained using anti-Pex14 antibodies. (I) EM of peroxisomes in MEFs. Peroxisomes were identified using cytochemical staining for catalase with DAB (arrows). (J) Cell proliferation (n ≥ 9). (K) Quantitation of Ki67-positive MEFs (n = 6; >100 cells/experiment). (L) Intracellular ATP levels in control (Drp1+/+ and Drp1+/−) and Drp1−/− MEFs (n ≥ 6). WT, wild type; KO, knockout. *, P < 0.05; **, P < 0.01; ***, P < 0.001. Error bars indicate mean ± SEM.
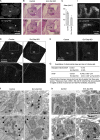
Figure 4.
Differential requirements for Drp1 in apoptosis, in vivo, and in vitro. (A) Whole-mount immunohistochemistry of embryos using antibodies to activated caspase-3. Arrows indicate apoptotic cells at the site of neural tube closure. (B) MEFs were incubated with 1 µM staurosporine for the indicated times, stained with Alexa Fluor 488–annexin V and propidium iodine, and analyzed by flow cytometry (n ≥ 3). (C) Quantitation of caspase activity (caspase-3/7) using the fluorogenic substrate DEVD-AFC. MEFs were left untreated (Cont) or treated with the following death stimuli and harvested at the indicated time points: 1 µM staurosporin (Sts; 6 h), 100 µM etoposide (Eto; 24 h), 600 J/m2 UV (24 h), and 10 ng/ml TNF-α plus 10 µg/ml cycloheximide (16 h; n ≥ 6). (D) Cytochrome c release during apoptosis. MEFs were incubated with 100 µM etoposide for 30 h in the presence of Z-VAD-FMK and immunostained using antibodies to cytochrome c and Tom20. Arrows indicate cells with released cytochrome c. (E) Quantitation of cytochrome c release (n = 3; >100 cells/experiment). (F) Quantitation of mitochondrial shape (n = 3; >100 cells/experiment). WT, wild type; KO, knockout. Error bars indicate mean ± SEM.
Figure 5.
Defects in cerebellar development in En1-Drp1KO mice. (A) Immunofluorescence of cerebellum (Cb) at P1 using anti-Drp1 antibodies. (B) H&E stains of sagittal sections of cerebella. (C) Area of cerebella in sagittal sections around the median line was determined (n = 3). (D and E) Sagittal cerebellar sections were immunostained using antibodies to Ki67 (D) or activated caspase-3 (E). (F) EM of PCs at P0. Arrows indicate mitochondria. Sagittal sections of cerebella are shown. (G) Quantitation of mitochondrial shape and size in PCs. (H) EM of granule cells (GC) in the external granular layer (EGL). Sagittal sections of cerebella are shown. (I) Immunofluorescence of sagittal cerebellar sections around the median line using anti-Car8 antibodies. PCL, PC layer. (D, F, and H) Boxed areas are enlarged in the corresponding panels below. *, P < 0.05. Error bars indicate mean ± SEM.
Similar articles
- Mitochondrial fission factor Drp1 is essential for embryonic development and synapse formation in mice.
Ishihara N, Nomura M, Jofuku A, Kato H, Suzuki SO, Masuda K, Otera H, Nakanishi Y, Nonaka I, Goto Y, Taguchi N, Morinaga H, Maeda M, Takayanagi R, Yokota S, Mihara K. Ishihara N, et al. Nat Cell Biol. 2009 Aug;11(8):958-66. doi: 10.1038/ncb1907. Epub 2009 Jul 5. Nat Cell Biol. 2009. PMID: 19578372 - A lethal de novo mutation in the middle domain of the dynamin-related GTPase Drp1 impairs higher order assembly and mitochondrial division.
Chang CR, Manlandro CM, Arnoult D, Stadler J, Posey AE, Hill RB, Blackstone C. Chang CR, et al. J Biol Chem. 2010 Oct 15;285(42):32494-503. doi: 10.1074/jbc.M110.142430. Epub 2010 Aug 9. J Biol Chem. 2010. PMID: 20696759 Free PMC article. - Drp1 polymerization stabilizes curved tubular membranes similar to those of constricted mitochondria.
Ugarte-Uribe B, Prévost C, Das KK, Bassereau P, García-Sáez AJ. Ugarte-Uribe B, et al. J Cell Sci. 2018 Apr 19;132(4):jcs208603. doi: 10.1242/jcs.208603. J Cell Sci. 2018. PMID: 29361534 - Molecular Basis of Mitochondrial and Peroxisomal Division Machineries.
Imoto Y, Itoh K, Fujiki Y. Imoto Y, et al. Int J Mol Sci. 2020 Jul 30;21(15):5452. doi: 10.3390/ijms21155452. Int J Mol Sci. 2020. PMID: 32751702 Free PMC article. Review. - Physiological roles of mitochondrial fission in cultured cells and mouse development.
Ishihara T, Kohno H, Ishihara N. Ishihara T, et al. Ann N Y Acad Sci. 2015 Sep;1350:77-81. doi: 10.1111/nyas.12848. Ann N Y Acad Sci. 2015. PMID: 26375863 Review.
Cited by
- Mitochondrial fission controls astrocyte morphogenesis and organization in the cortex.
Salazar MPR, Kolanukuduru S, Ramirez V, Lyu B, Sejourne G, Sesaki H, Yu G, Eroglu C. Salazar MPR, et al. bioRxiv [Preprint]. 2024 Oct 22:2024.10.22.619706. doi: 10.1101/2024.10.22.619706. bioRxiv. 2024. PMID: 39484572 Free PMC article. Preprint. - Molecular mechanisms of mitochondrial dynamics.
Tábara LC, Segawa M, Prudent J. Tábara LC, et al. Nat Rev Mol Cell Biol. 2024 Oct 17. doi: 10.1038/s41580-024-00785-1. Online ahead of print. Nat Rev Mol Cell Biol. 2024. PMID: 39420231 Review. - Use and Reuse of Animal Behavioral, Molecular, and Biochemical Data in Alzheimer's Disease Research: Focus on 3Rs and Saving People's Tax Dollars.
Islam MA, Kshirsagar S, Reddy AP, Sehar U, Reddy PH. Islam MA, et al. J Alzheimers Dis Rep. 2024 Sep 3;8(1):1171-1184. doi: 10.3233/ADR-240126. eCollection 2024. J Alzheimers Dis Rep. 2024. PMID: 39247873 Free PMC article. Review. - De Novo DNM1L Mutation in a Patient with Encephalopathy, Cardiomyopathy and Fatal Non-Epileptic Paroxysmal Refractory Vomiting.
Berti B, Verrigni D, Nasca A, Di Nottia M, Leone D, Torraco A, Rizza T, Bellacchio E, Legati A, Palermo C, Marchet S, Lamperti C, Novelli A, Mercuri EM, Bertini ES, Pane M, Ghezzi D, Carrozzo R. Berti B, et al. Int J Mol Sci. 2024 Jul 16;25(14):7782. doi: 10.3390/ijms25147782. Int J Mol Sci. 2024. PMID: 39063023 Free PMC article. - Developmental disruption of the mitochondrial fission gene drp-1 extends the longevity of daf-2 insulin/IGF-1 receptor mutant.
Traa A, Tamez González AA, Van Raamsdonk JM. Traa A, et al. Geroscience. 2024 Jul 19. doi: 10.1007/s11357-024-01276-z. Online ahead of print. Geroscience. 2024. PMID: 39028454
References
- Alavi M.V., Bette S., Schimpf S., Schuettauf F., Schraermeyer U., Wehrl H.F., Ruttiger L., Beck S.C., Tonagel F., Pichler B.J., et al. 2007. A splice site mutation in the murine Opa1 gene features pathology of autosomal dominant optic atrophy.Brain. 130:1029–1042 doi:<10.1093/brain/awm005> - DOI - PubMed
- Alexander C., Votruba M., Pesch U.E., Thiselton D.L., Mayer S., Moore A., Rodriguez M., Kellner U., Leo-Kottler B., Auburger G., et al. 2000. OPA1, encoding a dynamin-related GTPase, is mutated in autosomal dominant optic atrophy linked to chromosome 3q28.Nat. Genet. 26:211–215 doi:<10.1038/79944> - DOI - PubMed
Publication types
MeSH terms
Substances
LinkOut - more resources
Full Text Sources
Other Literature Sources
Molecular Biology Databases
Miscellaneous


