Genome-wide mutational diversity in an evolving population of Escherichia coli - PubMed (original) (raw)
Genome-wide mutational diversity in an evolving population of Escherichia coli
J E Barrick et al. Cold Spring Harb Symp Quant Biol. 2009.
Abstract
The level of genetic variation in a population is the result of a dynamic tension between evolutionary forces. Mutations create variation, certain frequency-dependent interactions may preserve diversity, and natural selection purges variation. New sequencing technologies offer unprecedented opportunities to discover and characterize the diversity present in evolving microbial populations on a whole-genome scale. By sequencing mixed-population samples, we have identified single-nucleotide polymorphisms (SNPs) present at various points in the history of an Escherichia coli population that has evolved for almost 20 years from a founding clone. With 50-fold genome coverage, we were able to catch beneficial mutations as they swept to fixation, discover contending beneficial alleles that were eliminated by clonal interference, and detect other minor variants possibly adapted to a new ecological niche. Additionally, there was a dramatic increase in genetic diversity late in the experiment after a mutator phenotype evolved. Still finer-resolution details of the structure of genetic variation and how it changes over time in microbial evolution experiments will enable new applications and quantitative tests of population genetic theory.
Figures
Figure 1. Expected dynamics in an evolving bacterial population
Lineages with new beneficial mutations are depicted as shaded wedges that originate in a previous genetic background and rise in frequency as they outcompete their ancestor and other lineages (Muller 1932). The same shading indicates lineages have equivalent fitnesses, and the path to the final dominant genotype containing five mutations is highlighted by the light gray curve. This figure was produced using a simulation with population size and mutation parameters meant to model the first 600 generations of the E. coli long-term evolution experiment (Woods 2005). Notice how the level of genetic diversity changes over time. Early on, a new beneficial mutation sweeps to fixation and the population has little diversity (a). Later, four lineages with different mutations coexist at appreciable frequencies for a time (b) before the descendants of one lineage become a majority (c).
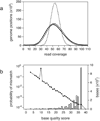
Figure 2. Example coverage distribution and base error rates
The 2K mixed-population sample is displayed as representative of the sequence datasets. (a) The distribution of the number of ancestral genomic positions with a given read coverage depth (open circles) is over-dispersed relative to a Poisson model (dashed line) but is fit reasonably well by a negative binomial model (solid line). Repeat regions were excluded from this analysis. (b) The probability of a base error at a given quality score estimated from the number of observed mismatches in reads aligned to the reference genome usually decreases as a higher quality score is assigned to a base. Bases assigned a quality score of 10 had an anomalously high error rate in this dataset. The accompanying histogram shows that most bases in the dataset had high quality scores. Bases assigned a quality score of 40 do not appear on the log scale because they had zero errors.
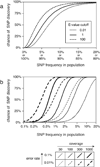
Figure 3. Sensitivity of SNP prediction procedure
(a) Estimates of the probability that our statistical procedure would detect SNPs present at various frequencies in a mixed-population sample at different E-value cutoffs. For these calculations, the coverage and quality score distributions were those of the mixed-population 2K sample. (b) Estimates of sensitivity improvements possible by increasing sequencing coverage and by reducing the rate of base errors. For these calculations all sites had uniform coverage and the same error rate for all bases.
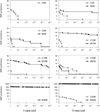
Figure 4. SNP predictions
The cumulative distributions of predictions below a given E-value threshold that also passed the bias filtering step are plotted for each dataset. Each panel contains a generation-paired mixed-population sample (squares and solid lines) and clone (circles and dashed lines), except there is only a clone at 0K and only a mixed population at 30K.
Figure 5. Mutational diversity in an evolving E. coli population
(a) Origin and eventual fate of point mutations in the 2K to 40K mixed-population samples. New mutations that first appear as SNPs or fixed alleles are shown as asterisks along the bottom or top, respectively, with arrows leading to the corresponding pools of SNPs and fixed mutations. Transient SNPs that were lost from the population are shown by descending lines ending in closed circles. Note that we only detect SNPs when they are between roughly 4% and 96% frequency in the population, and that we only recover approximately 50% of the SNPs at 5% frequency. Only the 49 SNP predictions in Table 2 were included for the 2K to 20K samples. (b) Stylized summary of the mixed-population SNP analysis. Shaded wedges represent subpopulations containing new mutations relative to the previous genetic background. Mutations are grouped to highlight their eventual fates, but we do not always have linkage information to resolve which SNPs occurred together. Labeled features are explained in the text.
Similar articles
- A direct experimental test of Ohno's hypothesis.
Mihajlovic L, Iyengar BR, Baier F, Barbier I, Iwaszkiewicz J, Zoete V, Wagner A, Schaerli Y. Mihajlovic L, et al. Elife. 2025 Apr 2;13:RP97216. doi: 10.7554/eLife.97216. Elife. 2025. PMID: 40172958 Free PMC article. - Evolutionary dynamics and structural consequences of de novo beneficial mutations and mutant lineages arising in a constant environment.
Kinnersley M, Schwartz K, Yang DD, Sherlock G, Rosenzweig F. Kinnersley M, et al. BMC Biol. 2021 Feb 4;19(1):20. doi: 10.1186/s12915-021-00954-0. BMC Biol. 2021. PMID: 33541358 Free PMC article. - Tempo and mode of genome evolution in a 50,000-generation experiment.
Tenaillon O, Barrick JE, Ribeck N, Deatherage DE, Blanchard JL, Dasgupta A, Wu GC, Wielgoss S, Cruveiller S, Médigue C, Schneider D, Lenski RE. Tenaillon O, et al. Nature. 2016 Aug 11;536(7615):165-70. doi: 10.1038/nature18959. Epub 2016 Aug 1. Nature. 2016. PMID: 27479321 Free PMC article. - Escherichia coli evolution during stationary phase.
Zinser ER, Kolter R. Zinser ER, et al. Res Microbiol. 2004 Jun;155(5):328-36. doi: 10.1016/j.resmic.2004.01.014. Res Microbiol. 2004. PMID: 15207864 Review. - Are Escherichia coli Pathotypes Still Relevant in the Era of Whole-Genome Sequencing?
Robins-Browne RM, Holt KE, Ingle DJ, Hocking DM, Yang J, Tauschek M. Robins-Browne RM, et al. Front Cell Infect Microbiol. 2016 Nov 18;6:141. doi: 10.3389/fcimb.2016.00141. eCollection 2016. Front Cell Infect Microbiol. 2016. PMID: 27917373 Free PMC article. Review.
Cited by
- Rapid selective sweep of pre-existing polymorphisms and slow fixation of new mutations in experimental evolution of Desulfovibrio vulgaris.
Zhou A, Hillesland KL, He Z, Schackwitz W, Tu Q, Zane GM, Ma Q, Qu Y, Stahl DA, Wall JD, Hazen TC, Fields MW, Arkin AP, Zhou J. Zhou A, et al. ISME J. 2015 Nov;9(11):2360-72. doi: 10.1038/ismej.2015.45. Epub 2015 Apr 7. ISME J. 2015. PMID: 25848870 Free PMC article. - Detecting rare structural variation in evolving microbial populations from new sequence junctions using breseq.
Deatherage DE, Traverse CC, Wolf LN, Barrick JE. Deatherage DE, et al. Front Genet. 2015 Jan 21;5:468. doi: 10.3389/fgene.2014.00468. eCollection 2014. Front Genet. 2015. PMID: 25653667 Free PMC article. - Universal Constraints on Protein Evolution in the Long-Term Evolution Experiment with Escherichia coli.
Maddamsetti R. Maddamsetti R. Genome Biol Evol. 2021 Jun 8;13(6):evab070. doi: 10.1093/gbe/evab070. Genome Biol Evol. 2021. PMID: 33856016 Free PMC article. - Reliable detection of subclonal single-nucleotide variants in tumour cell populations.
Gerstung M, Beisel C, Rechsteiner M, Wild P, Schraml P, Moch H, Beerenwinkel N. Gerstung M, et al. Nat Commun. 2012 May 1;3:811. doi: 10.1038/ncomms1814. Nat Commun. 2012. PMID: 22549840 - Adaptation to diverse nitrogen-limited environments by deletion or extrachromosomal element formation of the GAP1 locus.
Gresham D, Usaite R, Germann SM, Lisby M, Botstein D, Regenberg B. Gresham D, et al. Proc Natl Acad Sci U S A. 2010 Oct 26;107(43):18551-6. doi: 10.1073/pnas.1014023107. Epub 2010 Oct 11. Proc Natl Acad Sci U S A. 2010. PMID: 20937885 Free PMC article.
References
- Atwood KC, Schneider LK, Ryan FJ. Selective mechanisms in bacteria. Cold Spring Harb. Symp. Quant. Biol. 1951;16:345–355. - PubMed
- Barrick JE, Yu D-S, Yoon SH, Jeong H, Oh TK, Schneider D, Lenski RE, Kim JF. Genome dynamics in a long-term experiment with Escherichia coli. submitted. 2009 - PubMed
- Buckling A, Maclean CR, Brockhurst MA, Colegrave N. The Beagle in a bottle. Nature. 2009;457:824–829. - PubMed
Publication types
MeSH terms
Substances
LinkOut - more resources
Full Text Sources


