Evaluation of statistical methods for normalization and differential expression in mRNA-Seq experiments - PubMed (original) (raw)
Evaluation of statistical methods for normalization and differential expression in mRNA-Seq experiments
James H Bullard et al. BMC Bioinformatics. 2010.
Abstract
Background: High-throughput sequencing technologies, such as the Illumina Genome Analyzer, are powerful new tools for investigating a wide range of biological and medical questions. Statistical and computational methods are key for drawing meaningful and accurate conclusions from the massive and complex datasets generated by the sequencers. We provide a detailed evaluation of statistical methods for normalization and differential expression (DE) analysis of Illumina transcriptome sequencing (mRNA-Seq) data.
Results: We compare statistical methods for detecting genes that are significantly DE between two types of biological samples and find that there are substantial differences in how the test statistics handle low-count genes. We evaluate how DE results are affected by features of the sequencing platform, such as, varying gene lengths, base-calling calibration method (with and without phi X control lane), and flow-cell/library preparation effects. We investigate the impact of the read count normalization method on DE results and show that the standard approach of scaling by total lane counts (e.g., RPKM) can bias estimates of DE. We propose more general quantile-based normalization procedures and demonstrate an improvement in DE detection.
Conclusions: Our results have significant practical and methodological implications for the design and analysis of mRNA-Seq experiments. They highlight the importance of appropriate statistical methods for normalization and DE inference, to account for features of the sequencing platform that could impact the accuracy of results. They also reveal the need for further research in the development of statistical and computational methods for mRNA-Seq.
Figures
Figure 1
Comparison of differential expression statistics: ROC curves. (a) All DE statistics, no gene filtering. (b) GLM-based likelihood ratio statistics and _t_-statistics, before and after removing genes with fewer than 20 reads in either Brain or UHR. In both plots, a gene was declared non-DE if its qRT-PCR absolute log-ratio was less than 0.2 and DE if its absolute log-ratio was greater than 2.0. Note that we require a true positive to be differentially expressed in the same direction according to both mRNA-Seq and qRT-PCR (see Table 1 and Methods).
Figure 2
Differential expression statistics, by length. Boxplots of the ranks of DE statistics vs. gene lengths for UI genes at least 250 bp-long and with non-zero counts in both Brain and UHR. (a) Delta method _t_-statistics. (b) Delta method _t_-statistics weighted by the inverse of the square root of gene length.
Figure 3
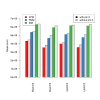
Impact of base-calling calibration method on read-mapping. Barplots of average read counts per lane with and without phi X calibration, for each of the four biological sample (Brain, UHR) and flow-cell (F2, F3) combinations. Reads are classified into three nested categories: purity-filtered perfectly matching reads (FPM); purity-filtered reads with either 0, 1, or 2 mismatches (FMM); unfiltered reads with either 0, 1, or 2 mismatches (MM).
Figure 4
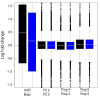
Comparison of biological, library preparation, and flow-cell effects. Boxplots of estimated log-fold-changes for UHR vs. Brain biological effects (GLM 2 in [Additional file 2: Supplemental Table S4]), flow-cell effects adjusting for biology (GLM 4), library preparation effects within flow-cell (GLM 7). Estimates are presented for total-count (black) and upper-quartile (blue) normalization.
Figure 5
Impact of highly-expressed genes. (a) Cumulative percentage of total read count for Brain (green) and UHR (purple) samples, starting with the gene with the highest read count (across the seven Brain or UHR lanes). Cumulative read counts are marked for the 5, 10, 20, and 30 percent most highly expressed genes. (b) Running value of the UHR/Brain expression fold-change for unnormalized counts, starting with the gene with the lowest total count across all 14 lanes. Horizontal lines correspond to: the ratio of the counts for all genes (black), the ratio of the counts for the POLR2A gene (red), and the ratio of the per-lane upper-quartile of counts for genes with reads in at least one lane (blue).
Figure 6
Comparison of mRNA-Seq and microarray differential expression calls to qRT-PCR: ROC curves. Genes common to all three platforms and present for both qRT-PCR and sequencing (see [Additional file 2: Supplemental Section S6]). evaluated and declared DE if their qRT-PCR absolute log-ratio was (a) greater than 2 or (b) greater than 0.5; genes were declared non-DE if their absolute log-ratio was less than 0.2. The GLM-based likelihood ratio test was used for the sequencing data. Two normalization procedures are presented for mRNA-Seq: total-count (black) and upper-quartile (blue) normalization. Microarray data were normalized using RMA (gray). Note that we require a true positive to be differentially expressed in the same direction according to both mRNA-Seq and qRT-PCR (see Table 1 and Methods).
Figure 7
Comparison of mRNA-Seq and microarray differential expression measures to qRT-PCR. Difference scatterplots comparing the estimates of UHR/Brain expression log-ratio from qRT-PCR to those from (a) mRNA-Seq, using the standard total-count normalization, and (b) microarrays, using the standard RMA normalization. Shown are the genes shared between all three platforms, present in both Brain and UHR according to both mRNA-Seq and qRT-PCR (see [Additional file 2: Supplemental Section S1]), and having absolute qRT-PCR expression log-ratio less than 4. Horizontal lines in (a) represent the median UHR/Brain log-ratio for the sequencing data after the standard total-count normalization (black), POLR2A normalization (red), quantile normalization (yellow), upper-quartile normalization (blue); horizontal lines in (b) show the median UHR/Brain log-ratio for the microarray data after the standard RMA normalization (black) and POLR2A normalization (red).
Figure 8
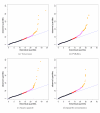
Comparison of normalization procedures: Goodness-of-fit of Poisson model. The multiplicative Poisson model (GLM 1 in [Additional file 2: Supplemental Table S4]) is fit to the seven Brain lanes in the MAQC-2 experiment after (a) total-count, (b) POLR2A, (c) upper-quartile, and (d) quantile normalization. Goodness-of-fit statistics are computed and displayed in _χ_2 quantile-quantile plots. Genes with goodness-of-fit statistics in the top quantiles of the _χ_2-distribution are displayed using colored plotting symbols: red (1, 5]%, purple (.1, 1]%, gold [0, .1]%. Similar plots for UHR show the same patterns.
Similar articles
- Comparison of normalization and differential expression analyses using RNA-Seq data from 726 individual Drosophila melanogaster.
Lin Y, Golovnina K, Chen ZX, Lee HN, Negron YL, Sultana H, Oliver B, Harbison ST. Lin Y, et al. BMC Genomics. 2016 Jan 5;17:28. doi: 10.1186/s12864-015-2353-z. BMC Genomics. 2016. PMID: 26732976 Free PMC article. - deGPS is a powerful tool for detecting differential expression in RNA-sequencing studies.
Chu C, Fang Z, Hua X, Yang Y, Chen E, Cowley AW Jr, Liang M, Liu P, Lu Y. Chu C, et al. BMC Genomics. 2015 Jun 13;16(1):455. doi: 10.1186/s12864-015-1676-0. BMC Genomics. 2015. PMID: 26070955 Free PMC article. - Selecting between-sample RNA-Seq normalization methods from the perspective of their assumptions.
Evans C, Hardin J, Stoebel DM. Evans C, et al. Brief Bioinform. 2018 Sep 28;19(5):776-792. doi: 10.1093/bib/bbx008. Brief Bioinform. 2018. PMID: 28334202 Free PMC article. - Statistical detection of differentially expressed genes based on RNA-seq: from biological to phylogenetic replicates.
Gu X. Gu X. Brief Bioinform. 2016 Mar;17(2):243-8. doi: 10.1093/bib/bbv035. Epub 2015 Jun 24. Brief Bioinform. 2016. PMID: 26108230 Review. - Characterizing and annotating the genome using RNA-seq data.
Chen G, Shi T, Shi L. Chen G, et al. Sci China Life Sci. 2017 Feb;60(2):116-125. doi: 10.1007/s11427-015-0349-4. Epub 2016 Jun 13. Sci China Life Sci. 2017. PMID: 27294835 Review.
Cited by
- Comparative motif discovery combined with comparative transcriptomics yields accurate targetome and enhancer predictions.
Naval-Sánchez M, Potier D, Haagen L, Sánchez M, Munck S, Van de Sande B, Casares F, Christiaens V, Aerts S. Naval-Sánchez M, et al. Genome Res. 2013 Jan;23(1):74-88. doi: 10.1101/gr.140426.112. Epub 2012 Oct 15. Genome Res. 2013. PMID: 23070853 Free PMC article. - LPEseq: Local-Pooled-Error Test for RNA Sequencing Experiments with a Small Number of Replicates.
Gim J, Won S, Park T. Gim J, et al. PLoS One. 2016 Aug 17;11(8):e0159182. doi: 10.1371/journal.pone.0159182. eCollection 2016. PLoS One. 2016. PMID: 27532300 Free PMC article. - How data analysis affects power, reproducibility and biological insight of RNA-seq studies in complex datasets.
Peixoto L, Risso D, Poplawski SG, Wimmer ME, Speed TP, Wood MA, Abel T. Peixoto L, et al. Nucleic Acids Res. 2015 Sep 18;43(16):7664-74. doi: 10.1093/nar/gkv736. Epub 2015 Jul 21. Nucleic Acids Res. 2015. PMID: 26202970 Free PMC article. - Polyester: simulating RNA-seq datasets with differential transcript expression.
Frazee AC, Jaffe AE, Langmead B, Leek JT. Frazee AC, et al. Bioinformatics. 2015 Sep 1;31(17):2778-84. doi: 10.1093/bioinformatics/btv272. Epub 2015 Apr 28. Bioinformatics. 2015. PMID: 25926345 Free PMC article. - Establishment of a pancreatic adenocarcinoma molecular gradient (PAMG) that predicts the clinical outcome of pancreatic cancer.
Nicolle R, Blum Y, Duconseil P, Vanbrugghe C, Brandone N, Poizat F, Roques J, Bigonnet M, Gayet O, Rubis M, Elarouci N, Armenoult L, Ayadi M, de Reyniès A, Giovannini M, Grandval P, Garcia S, Canivet C, Cros J, Bournet B, Buscail L; BACAP Consortium; Moutardier V, Gilabert M, Iovanna J, Dusetti N. Nicolle R, et al. EBioMedicine. 2020 Jul;57:102858. doi: 10.1016/j.ebiom.2020.102858. Epub 2020 Jul 3. EBioMedicine. 2020. PMID: 32629389 Free PMC article.
References
- Hoen PAC, Ariyurek Y, Thygesen HH, Vreugdenhil E, Vossen RHAM, de Menezes RX, Boer JM, van Ommen GJB, den Dunnen JT. Deep sequencing-based expression analysis shows major advances in robustness, resolution and inter-lab portability over five microarray platforms. Nucleic Acids Research. 2008;36(21):e141. doi: 10.1093/nar/gkn705. - DOI - PMC - PubMed
- Lee A, Hansen KD, Bullard J, Dudoit S, Sherlock G. Novel low abundance and transient RNAs in yeast revealed by tiling microarrays and ultra high-throughput sequencing are not conserved across closely related yeast species. PLoS Genetics. 2008;4(12):e1000299. doi: 10.1371/journal.pgen.1000299. - DOI - PMC - PubMed
Publication types
MeSH terms
Substances
LinkOut - more resources
Full Text Sources
Other Literature Sources


