The Summary Index of Malaria Surveillance (SIMS): a stable index of malaria within India - PubMed (original) (raw)
The Summary Index of Malaria Surveillance (SIMS): a stable index of malaria within India
Alan A Cohen et al. Popul Health Metr. 2010.
Abstract
Background: Malaria in India has been difficult to measure. Mortality and morbidity are not comprehensively reported, impeding efforts to track changes in disease burden. However, a set of blood measures has been collected regularly by the National Malaria Control Program in most districts since 1958.
Methods: Here, we use principal components analysis to combine these measures into a single index, the Summary Index of Malaria Surveillance (SIMS), and then test its temporal and geographic stability using subsets of the data.
Results: The SIMS correlates positively with all its individual components and with external measures of mortality and morbidity. It is highly consistent and stable over time (1995-2005) and regions of India. It includes measures of both vivax and falciparum malaria, with vivax dominant at lower transmission levels and falciparum dominant at higher transmission levels, perhaps due to ecological specialization of the species.
Conclusions: This measure should provide a useful tool for researchers looking to summarize geographic or temporal trends in malaria in India, and can be readily applied by administrators with no mathematical or scientific background. We include a spreadsheet that allows simple calculation of the index for researchers and local administrators. Similar principles are likely applicable worldwide, though further validation is needed before using the SIMS outside India.
Figures
Figure 1
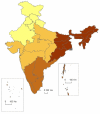
Map of state groupings used to generate regional analyses. Grouping of Indian states into regions of north, central, south, and northeast, for the purpose of comparing malaria indices generated in different regions to see if they agree.
Figure 2
Histogram of Pearson correlation coefficients among 51 potential indices. Histogram of Pearson correlation coefficients among the 51 alternative malaria indices generated from subsets of our data (geographic, temporal, or based on malaria levels). The indices are generated from principal component analyses run on the subsets by taking the loadings produced in the analyses and applying them to the full dataset. a) All correlations; b) only correlations among indices generated with the same variable subsets.
Figure 3
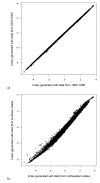
Correlations between two malaria indices generated from mutually exclusive portions of the dataset. Loadings from two separate principal components analyses using the measures %Pf, ABER, SPR, SFR, and MR were applied to the full dataset to generate the indices: a) 1995-1996 vs. 2003-2005; b) northeastern states (high malaria) vs. southern states (low malaria).
Figure 4
Maps of SIMS and other malaria indices by district in India, averaged 1995-2005. a) API (annual parasite index); b) SPR (slide positivity rate); c) SFR (slide falciparum rate); d) a normally distributed version of the SIMS (Summary Index of Malaria Surveillance); e) a fully exponentiated version of the SIMS; and f) the final SIMS. Scales differ across measures, but colors are divided into 12 equal classes comprising the full range of values for each measure and ensuring visual comparability across a) through f) for inferring the distribution. Note that the exponentiated SIMS matches the API, SPR, and SFR, but fails to distinguish well among districts at the lower end of the spectrum. The normally distributed SIMS fails to convey how much worse the problem is in high-malaria districts relative to most districts.
Figure 5
Histogram of values of the Summary Index of Malaria Surveillance (SIMS) taken by the district-years in our sample. Mean is 23.3, median is 20.6, and mode is approximately 18.
Figure 6
Correlations between various measures of malaria by district-year in India. Ellipses indicate Pearson correlation coefficients, with narrower ellipses showing stronger correlations. Right-slanted and blue indicate positive correlations, left-slanted and red indicate negative. SIMS = Summary Index of Malaria Surveillance; DLHS = morbidity from the District-level Household Survey, rounds 1 (1998-99) and 2 (2002-03); MDS = fever mortality from the Million Death Study, either malaria mortality ("malaria"), malaria mortality in only districts that had at least one malaria death ("high malaria") or fever of unknown origin ("FUO")); %Pf = percent of positive slides that are _falciparum_-positive; ABER = annual blood examination rate; API = annual parasite index; AFI = annual falciparum index; SPR = slide positivity rate; SFR = slide falciparum rate; MR = deaths/population.
Similar articles
- Malaria Surveillance - United States, 2016.
Mace KE, Arguin PM, Lucchi NW, Tan KR. Mace KE, et al. MMWR Surveill Summ. 2019 May 17;68(5):1-35. doi: 10.15585/mmwr.ss6805a1. MMWR Surveill Summ. 2019. PMID: 31099769 - The spatial and temporal patterns of falciparum and vivax malaria in Perú: 1994-2006.
Chowell G, Munayco CV, Escalante AA, McKenzie FE. Chowell G, et al. Malar J. 2009 Jun 27;8:142. doi: 10.1186/1475-2875-8-142. Malar J. 2009. PMID: 19558695 Free PMC article. - Malaria risk map for India based on climate, ecology and geographical modelling.
Sarkar S, Singh P, Lingala MAL, Verma P, Dhiman RC. Sarkar S, et al. Geospat Health. 2019 Nov 6;14(2). doi: 10.4081/gh.2019.767. Geospat Health. 2019. PMID: 31724378 - Malaria in Meghalaya: a systematic literature review and analysis of data from the National Vector-Borne Disease Control Programme.
Kessler A, van Eijk AM, Jamir L, Walton C, Carlton JM, Albert S. Kessler A, et al. Malar J. 2018 Nov 6;17(1):411. doi: 10.1186/s12936-018-2563-3. Malar J. 2018. PMID: 30400879 Free PMC article. - Epidemiology of Plasmodium vivax Malaria in India.
Anvikar AR, Shah N, Dhariwal AC, Sonal GS, Pradhan MM, Ghosh SK, Valecha N. Anvikar AR, et al. Am J Trop Med Hyg. 2016 Dec 28;95(6 Suppl):108-120. doi: 10.4269/ajtmh.16-0163. Epub 2016 Oct 5. Am J Trop Med Hyg. 2016. PMID: 27708188 Free PMC article. Review.
Cited by
- The intersection of geography and sociocultural factors in malaria epidemiology: A study of 6 years (2018-2023) surveillance data from three districts of Maharashtra, India, with diverse landscape.
Bawankar NS, Gedam DS, Meshram PP, Bhise SM, Kapse NS, Madavi SL, Bahirwar NM, Chavhan VS, Tyadi AA. Bawankar NS, et al. Trop Parasitol. 2025 Jan-Jun;15(1):25-32. doi: 10.4103/tp.tp_52_24. Epub 2025 Apr 5. Trop Parasitol. 2025. PMID: 40433647 Free PMC article. - Situational Analysis of Malaria Incidence Under Integrated Malaria Service in Hotspot Township - Minbya Township, Rakhine State, Myanmar, 2017-2020.
Oo AT, Chen H. Oo AT, et al. China CDC Wkly. 2024 Apr 26;6(17):374-377. doi: 10.46234/ccdcw2024.072. China CDC Wkly. 2024. PMID: 38737825 Free PMC article. - Detection of a novel, integrative aging process suggests complex physiological integration.
Cohen AA, Milot E, Li Q, Bergeron P, Poirier R, Dusseault-Bélanger F, Fülöp T, Leroux M, Legault V, Metter EJ, Fried LP, Ferrucci L. Cohen AA, et al. PLoS One. 2015 Mar 11;10(3):e0116489. doi: 10.1371/journal.pone.0116489. eCollection 2015. PLoS One. 2015. PMID: 25761112 Free PMC article. - Malaria Epidemiology Along the Indian Districts Bordering Bhutan and Implications for Malaria Elimination in the Region.
Gupta SK, Saroha P, Singh K, Saxena R, Barman K, Kumar A, Sharma A. Gupta SK, et al. Am J Trop Med Hyg. 2021 Nov 8;106(2):655-660. doi: 10.4269/ajtmh.21-0513. Am J Trop Med Hyg. 2021. PMID: 34749312 Free PMC article. - Mathematical modeling in perspective of vector-borne viral infections: a review.
Prasad R, Sagar SK, Parveen S, Dohare R. Prasad R, et al. Beni Suef Univ J Basic Appl Sci. 2022;11(1):102. doi: 10.1186/s43088-022-00282-4. Epub 2022 Aug 19. Beni Suef Univ J Basic Appl Sci. 2022. PMID: 36000145 Free PMC article. Review.
References
- Singh J. Malaria and Its Control in India. Perspectives in Public Health. 1952;72:515–525. - PubMed
- Zurbrigg S. Re-thinking the "human factor" in malaria mortality: the case of Punjab, 1868-1940. Parassitologia. 1994;36:121–135. - PubMed
- Akhtar R, Learmonth A, Keynes M. The resurgence of Malaria in India 1965-76. GeoJournal. 1977;1:69–80. doi: 10.1007/BF00704965. - DOI
- Kumar A, Valecha N, Jain T, Dash AP. Burden of Malaria in India: Retrospective and Prospective View. American Journal of Tropical Medicine and Hygiene. 2007;77:69–78. - PubMed
LinkOut - more resources
Full Text Sources


