MicroRNA-193b represses cell proliferation and regulates cyclin D1 in melanoma - PubMed (original) (raw)
MicroRNA-193b represses cell proliferation and regulates cyclin D1 in melanoma
Jiamin Chen et al. Am J Pathol. 2010 May.
Abstract
Cutaneous melanoma is an aggressive form of human skin cancer characterized by high metastatic potential and poor prognosis. To better understand the role of microRNAs (miRNAs) in melanoma, the expression of 470 miRNAs was profiled in tissue samples from benign nevi and metastatic melanomas. We identified 31 miRNAs that were differentially expressed (13 up-regulated and 18 down-regulated) in metastatic melanomas relative to benign nevi. Notably, miR-193b was significantly down-regulated in the melanoma tissues examined. To understand the role of miR-193b in melanoma, functional studies were undertaken. Overexpression of miR-193b in melanoma cell lines repressed cell proliferation. Gene expression profiling identified 314 genes down-regulated by overexpression of miR-193b in Malme-3M cells. Eighteen of these down-regulated genes, including cyclin D1 (CCND1), were also identified as putative miR-193b targets by TargetScan. Overexpression of miR-193b in Malme-3M cells down-regulated CCND1 mRNA and protein by > or = 50%. A luciferase reporter assay confirmed that miR-193b directly regulates CCND1 by binding to the 3'untranslated region of CCND1 mRNA. These studies indicate that miR-193b represses cell proliferation and regulates CCND1 expression and suggest that dysregulation of miR-193b may play an important role in melanoma development.
Figures
Figure 1
Unsupervised hierarchical clustering of miRNA expression data and heatmap of differentially expressed miRNAs. A: The dendrogram was generated by comparing miRNA expression profiles of metastatic melanomas (MEL) and benign nevi (NEVUS) using Cluster 3.0. Average linkage clustering was performed using uncentered correlation metric and visualized by Java Treeview. B: miRNAs were identified by SAM after comparing microarray results between metastatic melanomas and benign nevi (false discovery rate q < 0.001). The heatmap displays the log2 transformed fold changes. Red indicates overexpression, and green indicates down-regulation.
Figure 2
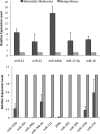
Real-time PCR analysis of miRNAs in melanoma. Candidates were selected from dysregulated miRNAs identified in the microarray study: up-regulated miRNAs in metastatic melanomas (upper) and down-regulated miRNAs in metastatic melanomas (lower). Their expression levels were quantified by the TaqMan microRNA assays. RNU6B was used as an internal control. Each sample was measured in triplicate. Data are the mean ± SEM of four tissue samples.
Figure 3
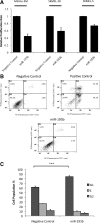
Effect of miR-193b overexpression on proliferation and apoptosis in melanoma cells. Malme-3M, SKMEL-28, and SKMEL-5 cells were transfected with miRNA precursors (either miR-193b or negative control) for 72 hours. A: Transfected cells, incubated with BrdU, were seeded at 3500 cells per well into 96-well black plate. After 24 hours, cell proliferation rate was assessed using the cell proliferation ELISA. The data are mean ± SEM from three independent experiments, each performed in octuplicate. B: Cells were fixed, stained with Annexin V FITC and PI, and analyzed by flow cytometry. Necrotic cells in D1, necrotic and late apoptotic cells in D2, viable cells in D3, and early apoptotic cells in D4. As a positive control, Malme-3M cells were treated with Mcl-1 DsiRNA and ABT-737 as described previously. Graphs show representative results from one of three independent experiments. C: Malme-3M cells were fixed and treated with RNase. After PI staining, cells were analyzed by flow cytometry. Data are the mean of four independent experiments, presented as mean ± SEM. ***P < 0.001 was calculated using G1 population by independent samples t test.
Figure 4
Ingenuity pathways analysis. Core analysis was performed on 314 genes down-regulated in Malme-3M cells after overexpressing miR-193b. Molecular and cellular functions associated with down-regulated genes were determined and analyzed by Fisher exact test. The threshold P value was 0.05. These data were generated through the use of Ingenuity Pathways Analysis online (Ingenuity Systems, Redwood City, CA).
Figure 5
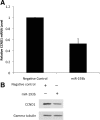
miR-193b represses CCND1 expression. Malme-3M cells were transfected with miRNA precursors (either miR-193b or negative control) for 72 hours. A: Real-time PCR was used to quantify CCND1 mRNA; β-actin was used as the internal control. Data are mean ± SEM of three independent experiments, each performed in triplicate. B: CCND1 protein was quantified by Western blotting. Gamma tubulin was used as the loading control. Representative data from one of three independent experiments are shown.
Figure 6
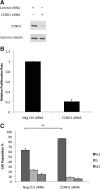
CCND1 knockdown suppresses cell proliferation. Malme-3M cells were transfected with either CCND1 siRNA or negative control (Neg Ctrl) siRNA for 72 hours. A: CCND1 protein was quantified by Western blotting. Gamma tubulin was used as the loading control. Representative data from one of three independent experiments are shown. B: Cell proliferation was measured as described in the legend to Figure 3A. The data are mean ± SEM from three independent experiments, each performed in octuplicate. C: Cell cycle progression was analyzed as described in the legend to Figure 3C. **P < 0.004 was calculated using G1 population by independent samples t test.
Figure 7
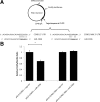
CCND1 is a direct target of miR-193b. A: Luciferase reporter vectors. A fragment of the CCND1 3′ UTR harboring the predicted binding site of miR-193b was cloned into a pGL3 control plasmid, downstream of a firefly luciferase reporter gene (pGL3-CCND1). The control vector (pGL3-CCND1 MM) included two mismatch mutations at the conserved binding site. The underlined 6-nucleotide indicates miR-193b seed sequence. Mismatch mutations are in bold and italic. B: Cells were cotransfected with 5 nmol/L miRNA precursors (either miR-193b or negative control), 400 ng firefly luciferase report plasmids (either pGL3-CCND1 or pGL3-CCND1 MM), and 50 ng renilla plasmids (pRL-TK). Cells were harvested 24 hours after transfection. Protein extracts were prepared and assayed for firefly and renilla luciferase activity. Firefly luciferase activity was normalized to renilla luciferase activity. Data are shown as the mean ± SEM of three replicates and are representative of three independent experiments. *P < 0.013 was calculated using independent samples t test.
Similar articles
- miR-193b Regulates Mcl-1 in Melanoma.
Chen J, Zhang X, Lentz C, Abi-Daoud M, Paré GC, Yang X, Feilotter HE, Tron VA. Chen J, et al. Am J Pathol. 2011 Nov;179(5):2162-8. doi: 10.1016/j.ajpath.2011.07.010. Epub 2011 Sep 3. Am J Pathol. 2011. PMID: 21893020 Free PMC article. - Dual-strand tumor suppressor miR-193b-3p and -5p inhibit malignant phenotypes of lung cancer by suppressing their common targets.
Choi KH, Shin CH, Lee WJ, Ji H, Kim HH. Choi KH, et al. Biosci Rep. 2019 Jul 12;39(7):BSR20190634. doi: 10.1042/BSR20190634. Print 2019 Jul 31. Biosci Rep. 2019. PMID: 31262974 Free PMC article. - Stathmin 1 is a potential novel oncogene in melanoma.
Chen J, Abi-Daoud M, Wang A, Yang X, Zhang X, Feilotter HE, Tron VA. Chen J, et al. Oncogene. 2013 Mar 7;32(10):1330-7. doi: 10.1038/onc.2012.141. Epub 2012 Jun 4. Oncogene. 2013. PMID: 22665054 - MicroRNA-193b inhibits the proliferation, migration and invasion of gastric cancer cells via targeting cyclin D1.
Wang L, Zhang Y, Zhao L, Liu S, Yu S, Ma Y, Sun G. Wang L, et al. Acta Histochem. 2016 May;118(4):323-30. doi: 10.1016/j.acthis.2016.02.001. Epub 2016 Apr 9. Acta Histochem. 2016. PMID: 27071318 - A Concise Review of MicroRNA-383: Exploring the Insights of Its Function in Tumorigenesis.
Yi Q, Xie W, Sun W, Sun W, Liao Y. Yi Q, et al. J Cancer. 2022 Jan 1;13(1):313-324. doi: 10.7150/jca.64846. eCollection 2022. J Cancer. 2022. PMID: 34976192 Free PMC article. Review.
Cited by
- miR-15a/16 are upreuglated in the serum of neonatal sepsis patients and inhibit the LPS-induced inflammatory pathway.
Wang X, Wang X, Liu X, Wang X, Xu J, Hou S, Zhang X, Ding Y. Wang X, et al. Int J Clin Exp Med. 2015 Apr 15;8(4):5683-90. eCollection 2015. Int J Clin Exp Med. 2015. PMID: 26131152 Free PMC article. - miR-200c inhibits melanoma progression and drug resistance through down-regulation of BMI-1.
Liu S, Tetzlaff MT, Cui R, Xu X. Liu S, et al. Am J Pathol. 2012 Nov;181(5):1823-35. doi: 10.1016/j.ajpath.2012.07.009. Epub 2012 Sep 13. Am J Pathol. 2012. PMID: 22982443 Free PMC article. - TGF-β1 alters microRNA profile in human gastric cancer cells.
Zhou H, Wang K, Hu Z, Wen J. Zhou H, et al. Chin J Cancer Res. 2013 Feb;25(1):102-11. doi: 10.3978/j.issn.1000-9604.2013.01.09. Chin J Cancer Res. 2013. PMID: 23372348 Free PMC article. - Clinical significance of miR-140-5p and miR-193b expression in patients with breast cancer and relationship to IGFBP5.
Güllü G, Peker I, Haholu A, Eren F, Küçükodaci Z, Güleç B, Baloglu H, Erzik C, Özer A, Akkiprik M. Güllü G, et al. Genet Mol Biol. 2015 Mar;38(1):21-9. doi: 10.1590/S1415-475738120140167. Epub 2014 Mar 17. Genet Mol Biol. 2015. PMID: 25983620 Free PMC article. - Non-coding RNAs in skin cancers: An update.
Kaushik SB, Kaushik N. Kaushik SB, et al. Noncoding RNA Res. 2016 Nov 24;1(1):83-86. doi: 10.1016/j.ncrna.2016.11.003. eCollection 2016 Oct. Noncoding RNA Res. 2016. PMID: 30159415 Free PMC article. Review.
References
- Cummins DL, Cummins JM, Pantle H, Silverman MA, Leonard AL, Chanmugam A. Cutaneous malignant melanoma. Mayo Clin Proc. 2006;81:500–507. - PubMed
- Bevona C, Sober AJ. Melanoma incidence trends. Dermatol Clin. 2002;20:589–595, vii.. - PubMed
- Gray-Schopfer V, Wellbrock C, Marais R. Melanoma biology and new targeted therapy. Nature. 2007;445:851–857. - PubMed
- Miller AJ, Mihm MC., Jr Melanoma. N Engl J Med. 2006;355:51–65. - PubMed
- Bartel DP. MicroRNAs: genomics, biogenesis, mechanism, and function. Cell. 2004;116:281–297. - PubMed
Publication types
MeSH terms
Substances
LinkOut - more resources
Full Text Sources
Other Literature Sources
Medical
Molecular Biology Databases
Research Materials

