MicroRNA cluster 221-222 and estrogen receptor alpha interactions in breast cancer - PubMed (original) (raw)
. 2010 May 19;102(10):706-21.
doi: 10.1093/jnci/djq102. Epub 2010 Apr 13.
Pierluigi Gasparini, Claudia Piovan, Apollinaire Ngankeu, Michela Garofalo, Cristian Taccioli, Marilena V Iorio, Meng Li, Stefano Volinia, Hansjuerg Alder, Tatsuya Nakamura, Gerard Nuovo, Yunlong Liu, Kenneth P Nephew, Carlo M Croce
Affiliations
- PMID: 20388878
- PMCID: PMC2873185
- DOI: 10.1093/jnci/djq102
MicroRNA cluster 221-222 and estrogen receptor alpha interactions in breast cancer
Gianpiero Di Leva et al. J Natl Cancer Inst. 2010.
Abstract
Background: Several lines of evidence have suggested that estrogen receptor alpha (ERalpha)-negative breast tumors, which are highly aggressive and nonresponsive to hormonal therapy, arise from ERalpha-positive precursors through different molecular pathways. Because microRNAs (miRNAs) modulate gene expression, we hypothesized that they may have a role in ER-negative tumor formation.
Methods: Gene expression profiles were used to highlight the global changes induced by miRNA modulation of ERalpha protein. miRNA transfection and luciferase assays enabled us to identify new targets of miRNA 206 (miR-206) and miRNA cluster 221-222 (miR-221-222). Northern blot, luciferase assays, estradiol treatment, and chromatin immunoprecipitation were performed to identify the miR-221-222 transcription unit and the mechanism implicated in its regulation.
Results: Different global changes in gene expression were induced by overexpression of miR-221-222 and miR-206 in ER-positive cells. miR-221 and -222 increased proliferation of ERalpha-positive cells, whereas miR-206 had an inhibitory effect (mean absorbance units [AU]: miR-206: 500 AU, 95% confidence interval [CI]) = 480 to 520; miR-221: 850 AU, 95% CI = 810 to 873; miR-222: 879 AU, 95% CI = 850 to 893; P < .05). We identified hepatocyte growth factor receptor and forkhead box O3 as new targets of miR-206 and miR-221-222, respectively. We demonstrated that ERalpha negatively modulates miR-221 and -222 through the recruitment of transcriptional corepressor partners: nuclear receptor corepressor and silencing mediator of retinoic acid and thyroid hormone receptor.
Conclusions: These findings suggest that the negative regulatory loop involving miR-221-222 and ERalpha may confer proliferative advantage and migratory activity to breast cancer cells and promote the transition from ER-positive to ER-negative tumors.
Figures
Figure 1
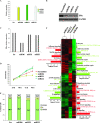
Effect of miR-221, -222, and -206 on gene expression. MCF7 cells were transfected with scrambled sequence mRNA control and miR-206, -221, and -222 (100 nM) and collected 72 hours after transfection. A) miR-206, 221, and 222 levels were assayed by quantitative real-time polymerase chain reaction (qRT-PCR) analyses. The experiment was repeated twice, each with three replicates. Means (bars) and 95% confidence intervals (error bars) are shown. B) Estrogen receptor α (ERα) expression levels were analyzed by western blot, and glyceraldehyde-3-phosphate dehydrogenase (GAPDH) levels were used as a loading control. The following antibodies were used: mouse monoclonal anti-ERα (Santa Cruz, Inc, sc-8002; dilution 1:1000) and mouse monoclonal anti-GAPDH (Calbiochem [Gibbstown, NJ], CB1001; dilution 1:10000). C) ERα mRNA expression levels were analyzed by qRT-PCR. GAPDH levels were used as a normalizer. The experiments were performed twice with similar results. D) Cell growth was measured by a 3-(4,5-dimethylthiazol-2-yl)-2,5-diphenyltetrazolium bromide–based colorimetric cell proliferation assay. The experiment was repeated four times, each with eight replicates, and the data are expressed as mean absorbance units with 95% confidence intervals (error bars). E) miR-transfected MCF7 cells were also subjected to fluorescence-activated cell sorting analysis, and the relative G1, S, and G2/M compartments calculated. Percentages of cells in each compartment are means of three independent experiments performed in triplicate. F) Unsupervised clustering of genes differentially expressed between scrambled sequence mRNA control, miR-206, -221, and -222; representative miR-activated genes (red) and miR-repressed genes (green) are listed under each molecular pathway. Impact factor strength of miR-activated (red bars) and repressed (green bars) genes is shown. Scr = scrambled sequence microRNA control.
Figure 2
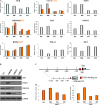
Effects of miR-206, -221, and -222 on expression of tumor-suppressor and metastasis genes. A) Quantitative real-time polymerase chain reaction to confirm the expression levels of multiple genes statistically significantly modulated in the microarray analyses: progesterone receptor (PGR), caveolin (CAV) 1, CAV2, DNA polymerase alpha 1 (POLA1), tuberous sclerosis 1 (TSC1), phosphatase and tensin homolog (PTEN), bone morphogenetic protein 4 (BMP) 4, BMP7, forkhead box O3 (FOXO3), hepatocyte growth factor receptor (MET), cyclin-dependent kinase inhibitor 1B (CDKN1B), and BCL2-like 11 apoptosis facilitator (BIM). The results were normalized to glyceraldehyde-3-phosphate dehydrogenase (GAPDH) mRNA levels. Experiments were repeated twice in triplicate with similar results. Means (bars) and 95% confidence intervals (error bars) are shown. B) Western blot analyses for MET, FOXO3, CDKN1B, and BIM expression in MCF7 cells after miR-206, -221 and -222 overexpression. GAPDH was used as a loading control. The following antibodies were used: rabbit polyclonal anti-MET (Santa Cruz, Inc., sc-10; dilution 1:500), rabbit polyclonal anti-FOXO3 (Millipore [Billerica, MA], 07-702; dilution 1:1000), rabbit polyclonal anti-CDKN1B (Santa Cruz, Inc, sc-528; dilution 1:500), rabbit polyclonal anti-BIM (Santa Cruz, Inc, sc-11425; dilution 1:1500), and mouse monoclonal anti-GAPDH (Calbiochem CB1001; dilution 1:10000). C) Schematic representation of the CDKN1B promoter and the reported FOXO3-binding site. D) Luciferase assay of CDKN1B promoter in two estrogen receptor–positive cell lines, MCF7 and T47D, after miR-221, -222, and -206 overexpression; luciferase experiments were performed in quadruplicate, and luciferase activity was read in triplicate. Data are presented as means of relative luciferase activity (bars) and 95% confidence intervals (error bars). Scr = scrambled sequence microRNA control; TSS = transcription start site.
Figure 3
Identification of new miR-221, -222, and -206 targets. A) Intersection of predicted miR-221, -222, and -206 targets (from TargetScan) with the 2390, 1014, and 936 genes statistically significantly repressed by miR-206, -221, and -222, respectively. B) Intersection of repressed targets of miR-221, -222, and -206. C) Schematic diagram depicts two potential binding sites for miR-206 in the hepatocyte growth factor receptor (MET) 3′ untranslated region (3′UTR), predicted by the TargetScan database; “Poorly conserved” (green) and “conserved” (orange) seed regions were mapped at 499–505 and 811–817 nucleotides, respectively, from the translation stop codon. D) Luciferase activities for MET wild type (wt) and MET mutant (mut) plasmids were determined after transfection of Meg01 cells; all luciferase experiments were performed in quadruplicate, and the luciferase activity was read in triplicate. Data are presented as means (bars) of relative luciferase activity and 95% confidence intervals (error bars). E) Schematic diagram depicts the potential binding for miR-221 and -222, predicted by TargetScan database, in the forkhead box O3 (FOXO3) 3′UTR. F) Luciferase assays for FOXO3 were performed and represented as previously described in (D). Scr = scrambled sequence microRNA control.
Figure 4
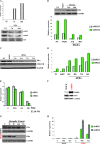
Negative regulation of miR-221 and -222 expression by estrogen receptor α (ERα). A) MDA-MB-231 cells were treated with 5-aza-2′-deoxycytidine (5′AZA) at a concentration of 10 μM for 10 days. 5′AZA-treated cells were subjected to quantitative real-time polymerase chain reaction (qRT-PCR) analysis for the detection of ERα transcript, and the data are expressed relative to glyceraldehyde-3-phosphate dehydrogenase (GAPDH) mRNA expression (top). miR-221 and -222 expression levels were detected by northern blot analysis. Ethidium bromide (EtBr) staining is shown as a loading control (bottom). The experiments were repeated twice with similar results. B) MDA-MB-231 cells were cultured for 5 days in hormone-deprived media and were transfected with the pCruz-HA-ERα construct and an empty control. Twenty-four hours after transfection, cells were stimulated by adding estradiol (E2) at a concentration of 10 nM and were kept in culture for an additional 48 hours. Transfected cells were subjected to western blotting analysis for the detection of HA-ERα (top) and to qRT-PCR analysis (bottom) for the quantitative detection of mature miR-221 and 222. (C and D) ERα-positive MCF7 cells were transfected with small interfering RNA (siRNA) against ERα or with a control siRNA-targeting green fluorescent protein. Twenty-four, 48, 72, and 96 hours after transfection, transfected cells were subjected to western blotting analysis (C) for the detection of ERα and cyclin-dependent kinase inhibitor 1B (CDKN1B) protein. GAPDH was used as a loading control for the experiments. qRT-PCR analyses (D) were also used for the quantitative detection of mature miR-221-222. E) MCF7 cells were hormone starved for 5 days and were then stimulated by adding E2 at a concentration of 10 nM. Total RNAs from E2-treated cells were subjected to qRT-PCR for detection of mature miR-221-222. (F, G, H) MCF7-mock and MCF7-HER2 cell lines were analyzed by western blotting for the detection of HER2 and ERα (F); MCF7-mock and MCF7-HER2 cell lines were starved for 48 hours and then activated with heregulin β1 at a concentration of 10 ng/mL. Cells were collected and analyzed for ERα (G) and miR-221 and 222 expression levels (H). Except where noted, all data are expressed as means of three experiments (bars) and 95% confidence intervals (error bars). For the western blot analyses, the following antibodies were used: mouse monoclonal anti-HA-HRP conjugates (Roche Molecular Biochemicals; dilution 1:500), mouse monoclonal anti-ERα (Santa Cruz, Inc, sc-8002; dilution 1:1000), rabbit polyclonal anti-CDKN1B (Santa Cruz, Inc, sc-528; dilution 1:500), rabbit polyclonal anti–v-erb-b2 erythroblastic leukemia viral oncogene homolog 2 (ERBB2) (Santa Cruz, Inc, sc-134481; dilution 1:500), mouse monoclonal anti-GAPDH (Calbiochem CB1001; dilution 1:10000). NT = not treated; Scr = scrambled sequence microRNA control.
Figure 5
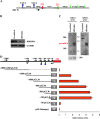
Identification of miR-221-222 transcriptional unit. A) Eleven-kilobase genomic region spanning miR-221 and -222 was analyzed using the Promoter 2.0 and human polyA signals databases to search for promoter and polyA signal sequences. The schematic diagram represents two canonical TATA boxes (blue triangles) located 550 and 190 base pair (bp) upstream of pre-miR-222 (red circle) and three polyA signals (green arrows) located downstream of pre-miR-221 (green circle). (B and C) MDA-MB-231 cells overexpressing miR-221 and -222 were transfected with small interfering RNA (siRNA) against DROSHA or control siRNA against green fluorescent protein (100 nM). B) Seventy-two hours after transfection, siRNA-treated cells were subjected to western blot analysis for the detection of DROSHA protein, and glyceraldehyde-3-phosphate dehydrogenase (GAPDH) levels were used as a loading control. The following antibodies were used: rabbit polyclonal anti-Drosha (Santa Cruz, Inc, sc-33778; dilution 1:500), mouse monoclonal anti-GAPDH (Calbiochem CB1001; dilution 1:10000). C) Seventy-two hours after transfection, siRNA-treated cells were also subjected to northern blot analysis for the detection of miR-221 (left panel) and 222 (right panel) primary transcript. Positions of the RNA marker (Invitrogen) are shown between the panels. Ethidium bromide staining of 28S ribosomal RNA is shown as a loading control. The experiments were repeated twice with similar results. D) Luciferase assays were carried out to identify the miR-221-222 promoter. Genomic fragments located upstream of pre-miR-222 and cloned into the pGL3-basic vector are shown on left. Twenty-four hours after transfection, luciferase activity assays of Meg01 cells transfected with respective reporter constructs were performed. All luciferase experiments were performed four times in duplicate, and data are represented with 95% of confidence intervals. ChrX = chromosome X; pri-miR = primary transcript of microRNAs.
Figure 6
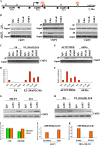
Binding of estrogen receptor α (ERα) to miR-221-222 and recruitment of corepressor proteins nuclear receptor corepressor (NCoR) and silencing mediator of retinoic acid and thyroid hormone receptor (SMRT). A) Schematic diagram of miR-221-222 transcription unit with transcription start site (red circle: miR-222, green circle: miR-221), polyA signal, and canonical ERα-binding sites (yellow triangles). Chromatin immunoprecipitation (ChIP)–analyzed regions are indicated with three pairs of black arrowheads. B) Cross-linked chromatin was prepared from MDA-MB-231 (ER-negative) and from MCF7 (ER-positive) cells and subjected to ChIP assays. The polymerase chain reaction (PCR) products were analyzed on 2% agarose gels. Input indicates a 5% portion of the ChIP input. All the experiments were performed in triplicate with similar results. C) MCF7 cells were hormone starved for 5 days and then stimulated by adding estradiol (E2) at a concentration of 10 nM. Twenty-four hours after stimulation, cells were cross-linked and subjected to ChIP assays. D) The amount of ChIP-enriched DNA was quantified by quantitative real-time PCR (qRT-PCR), and the results were shown as relative enrichment. The data are presented as means of three experiments. E) MCF7 were transfected with small interfering RNA (siRNA) against ERα or control siRNA. Seventy-two hours after transfection, siRNA-treated cells were cross-linked and were subjected to ChIP assay. F) The amount of ChIP-enriched DNA was quantified by qRT-PCR, and the results were shown as relative enrichment. The data represent mean of three experiments. G) MCF7 and MDA-MB-231 cells were grown to 70% confluence and subjected to ChIP analyses to analyze histone H3 and H4 acetylation status. The experiment was performed in duplicate with the same results. H) Estradiol-stimulated MCF7 cells were subjected to ChIP assays to check the acetylation status of miR-221-222 promoter. The experiment was performed in duplicate with the same results. I) The minus 200/ERE-pGL3b and minus 200 pGL3b constructs were transfected into MCF7 and MDA-MD-231 cells; 24 hours after transfection, luciferase assays were performed and results represented as relative luciferase activity. J) Luciferase activity of minus 200/ERE in ER-positive cells, MCF7, after ERα knockdown. K) Luciferase activity of minus 200/ERE in ER-negative cells, MDA-MB-231, after ERα restoration. All luciferase experiments were performed in triplicate, and the luciferase activity was read in triplicate. Error bars = 95% confidence intervals. AcH3 = acetyl histone H3; AcH4 = acetyl histone H4; ERE = estrogen response element; IgG = immunoglobulin control; nt = nucleotides.
Figure 7
Effects of miR-206, -221, and -222 on oncogenic activity in breast cancer cells. Schematic representation of the differential effects of miR-221-222 and miR-206 on estrogen receptor (ER)-positive cells. The red cross indicates double suppressive effect of forkhead box O3 (FOXO3) on cyclin-dependent kinase inhibitor 1B (CDKN1B) and BIM (bcl2 interacting mediator of cell death). Orange lines indicate transcriptional regulation; blue lines indicate posttranscriptional regulation. DDIT4 = DNA damage–inducible transcript 4.
Similar articles
- The ERα-miR-575-p27 feedback loop regulates tamoxifen sensitivity in ER-positive Breast Cancer.
Liu SS, Li Y, Zhang H, Zhang D, Zhang XB, Wang X, Yu Y. Liu SS, et al. Theranostics. 2020 Aug 29;10(23):10729-10742. doi: 10.7150/thno.46297. eCollection 2020. Theranostics. 2020. PMID: 32929377 Free PMC article. - Downregulation of microRNA-515-5p by the estrogen receptor modulates sphingosine kinase 1 and breast cancer cell proliferation.
Pinho FG, Frampton AE, Nunes J, Krell J, Alshaker H, Jacob J, Pellegrino L, Roca-Alonso L, de Giorgio A, Harding V, Waxman J, Stebbing J, Pchejetski D, Castellano L. Pinho FG, et al. Cancer Res. 2013 Oct 1;73(19):5936-48. doi: 10.1158/0008-5472.CAN-13-0158. Epub 2013 Aug 8. Cancer Res. 2013. PMID: 23928990 - The estrogen receptor-alpha-induced microRNA signature regulates itself and its transcriptional response.
Castellano L, Giamas G, Jacob J, Coombes RC, Lucchesi W, Thiruchelvam P, Barton G, Jiao LR, Wait R, Waxman J, Hannon GJ, Stebbing J. Castellano L, et al. Proc Natl Acad Sci U S A. 2009 Sep 15;106(37):15732-7. doi: 10.1073/pnas.0906947106. Epub 2009 Aug 24. Proc Natl Acad Sci U S A. 2009. PMID: 19706389 Free PMC article. - Interplay between steroid signalling and microRNAs: implications for hormone-dependent cancers.
Fletcher CE, Dart DA, Bevan CL. Fletcher CE, et al. Endocr Relat Cancer. 2014 Oct;21(5):R409-29. doi: 10.1530/ERC-14-0208. Epub 2014 Jul 25. Endocr Relat Cancer. 2014. PMID: 25062737 Review. - miRNA-dependent resistance mechanisms to anti-hormonal therapies in estrogen receptor-positive breast cancer patients.
Al Hashami ZS, van der Vegt B, Mourits MJE, Kluiver J, van den Berg A. Al Hashami ZS, et al. Mol Ther Oncol. 2025 Jan 28;33(1):200941. doi: 10.1016/j.omton.2025.200941. eCollection 2025 Mar 20. Mol Ther Oncol. 2025. PMID: 40190354 Free PMC article. Review.
Cited by
- Vitamin D and microRNAs in bone.
Lisse TS, Adams JS, Hewison M. Lisse TS, et al. Crit Rev Eukaryot Gene Expr. 2013;23(3):195-214. doi: 10.1615/critreveukaryotgeneexpr.2013007147. Crit Rev Eukaryot Gene Expr. 2013. PMID: 23879537 Free PMC article. Review. - Identification and pathway analysis of microRNAs with no previous involvement in breast cancer.
Romero-Cordoba S, Rodriguez-Cuevas S, Rebollar-Vega R, Quintanar-Jurado V, Maffuz-Aziz A, Jimenez-Sanchez G, Bautista-Piña V, Arellano-Llamas R, Hidalgo-Miranda A. Romero-Cordoba S, et al. PLoS One. 2012;7(3):e31904. doi: 10.1371/journal.pone.0031904. Epub 2012 Mar 16. PLoS One. 2012. PMID: 22438871 Free PMC article. - The direct effect of fibroblast growth factor 23 on vascular smooth muscle cell phenotype and function.
Vergara N, de Mier MVP, Rodelo-Haad C, Revilla-González G, Membrives C, Díaz-Tocados JM, Martínez-Moreno JM, Torralbo AI, Herencia C, Rodríguez-Ortiz ME, López-Baltanás R, Richards WG, Felsenfeld A, Almadén Y, Martin-Malo A, Ureña J, Santamaría R, Soriano S, Rodríguez M, Muñoz-Castañeda JR. Vergara N, et al. Nephrol Dial Transplant. 2023 Feb 13;38(2):322-343. doi: 10.1093/ndt/gfac220. Nephrol Dial Transplant. 2023. PMID: 35867864 Free PMC article. - Improved sensitivity for detection of breast cancer by combination of miR-34a and tumor markers CA 15-3 or CEA.
Zaleski M, Kobilay M, Schroeder L, Debald M, Semaan A, Hettwer K, Uhlig S, Kuhn W, Hartmann G, Holdenrieder S. Zaleski M, et al. Oncotarget. 2018 Apr 27;9(32):22523-22536. doi: 10.18632/oncotarget.25077. eCollection 2018 Apr 27. Oncotarget. 2018. PMID: 29854296 Free PMC article. - Exploring miRNA-Associated Signatures with Diagnostic Relevance in Glioblastoma Multiforme and Breast Cancer Patients.
LeBlanc VC, Morin P. LeBlanc VC, et al. J Clin Med. 2015 Aug 14;4(8):1612-30. doi: 10.3390/jcm4081612. J Clin Med. 2015. PMID: 26287251 Free PMC article. Review.
References
- Elledge RM, Allred DC. Clinical aspect of estrogen and progesterone receptors. In: Harris JR, Lippman ME, Morrow M, Osborne CK, editors. Disease of the Breast. Philadelphia, PA: Lippincott Williams and Wilkins; 2004. pp. 601–617.
- Santen RJ, Song RX, McPherson R, et al. The role of mitogen-activated protein (MAP) kinase in breast cancer. J Steroid Biochem Mol Biol. 2002;80(2):239–256. - PubMed
- Stoner M, Saville B, Wormke M, et al. Hypoxia induces proteasome-dependent degradation of estrogen receptor alpha in ZR-75 breast cancer cells. Mol Endocrinol. 2002;16(10):2231–2242. - PubMed
- Oh AS, Lorant LA, Holloway JN, et al. Hyperactivation of MAPK induces loss of ERalpha expression in breast cancer cells. Mol Endocrinol. 2001;15(8):1344–1359. - PubMed
Publication types
MeSH terms
Substances
LinkOut - more resources
Full Text Sources
Other Literature Sources
Medical
Molecular Biology Databases
Research Materials
Miscellaneous
