Action potentials initiate in the axon initial segment and propagate through axon collaterals reliably in cerebellar Purkinje neurons - PubMed (original) (raw)
Action potentials initiate in the axon initial segment and propagate through axon collaterals reliably in cerebellar Purkinje neurons
Amanda Foust et al. J Neurosci. 2010.
Abstract
Purkinje neurons are the output cells of the cerebellar cortex and generate spikes in two distinct modes, known as simple and complex spikes. Revealing the point of origin of these action potentials, and how they conduct into local axon collaterals, is important for understanding local and distal neuronal processing and communication. By using a recent improvement in voltage-sensitive dye imaging technique that provided exceptional spatial and temporal resolution, we were able to resolve the region of spike initiation as well as follow spike propagation into axon collaterals for each action potential initiated on single trials. All fast action potentials, for both simple and complex spikes, whether occurring spontaneously or in response to a somatic current pulse or synaptic input, initiated in the axon initial segment. At discharge frequencies of less than approximately 250 Hz, spikes propagated faithfully through the axon and axon collaterals, in a saltatory manner. Propagation failures were only observed for very high frequencies or for the spikelets associated with complex spikes. These results demonstrate that the axon initial segment is a critical decision point in Purkinje cell processing and that the properties of axon branch points are adjusted to maintain faithful transmission.
Figures
Figure 1.
Methods for obtaining voltage-sensitive dye recordings from Purkinje cell axons. Schematic of the experimental setup shown in the middle: IR-DIC video microscopy was used for patching neurons; the voltage-sensitive dye was excited using a 532 nm solid-state laser in wide-field illumination mode; emission light was recorded with a high-speed CCD-camera; a spinning-disc confocal scanner was used for morphological reconstruction. A, A composite EGFP fluorescence image of a Purkinje cell with intact axonal arbor generated from stacks of images obtained with a spinning-disc confocal scanner. Cerebellar slices were from transgenic mouse lines (L7-tau-GFP shown; pcp2-EGFP was also used) in which GFP or EGFP was expressed in Purkinje cells. B, Voltage-sensitive dye fluorescence image of a part of the axonal arbor in recording position obtained with the CCD camera for voltage imaging (different cell from A).
Figure 2.
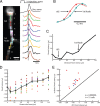
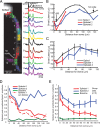
Action potentials initiate in the Purkinje cell axon initial segment. A, Voltage-sensitive dye fluorescence image of the soma–axon region in recording position shown on the left. Traces on the right, Single-trial recordings of AP signals, initiated by somatic current injection, from nine locations indicated on the image. Each trace is a spatial average of four to five same-color pixels. Signals are scaled to the same peak height. The symbols represent actual data points; the solid lines are reconstructed signals using cubic spline interpolation. The vertical line denotes the time at half-maximum amplitude at the edge of the soma (location 1). Note that the AIS segment traces (green and red) initiate the action potential first. B, AP recordings from the AIS and the first node of Ranvier scaled to the same height and compared on an expanded timescale. C, The time to half-maximum amplitude subtracted from the time at half-max for the edge of the soma (“onset latency”) as a function of distance from the soma. D, Group data (n = 15) illustrating the level of consistency in the spatial localization of spike onset and the spike propagation velocity across cells. Error bars indicate SEM. E, Group data statistics. The onset latency is lowest in the axon initial segment, and in all cells preceded the spike in the first node of Ranvier (p = 0.000006; n = 15). The diagonal line represents equity. The diamonds represent spikes initiated with a current pulse. The data obtained from spontaneous spikes are indicated by X's. The data in red was obtained at 35°C, whereas the data in blue was obtained at 23°C.
Figure 3.
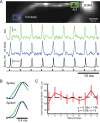
All action potentials of a train initiate in the axon initial segment. A, Voltage-sensitive dye fluorescence image of the soma–axon region in recording position shown on top. Traces below are AP signals evoked by repetitive soma stimulation at 200 Hz (bottom trace). Signals were recorded by an electrode in the soma (black) and optically from AIS and first node of Ranvier (blue and green) as indicated on the image. The scale bar illustrates percentage Δ_F_/F for the optical signals. B, Comparison of AP waveforms from the AIS (green) and first node (blue) for the first and ninth spike in the train. C, Latency difference between the first node and AIS for the nine spikes in the train; AIS discharges first for all spikes. The equation is the best linear fit of the data, and the slope of this line is not significantly different from zero (p = 0.89; n = 3 cells). Error bars indicate SEM.
Figure 4.
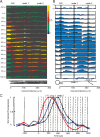
Action potentials propagate in a saltatory manner. A, Spontaneously initiated action potential. Bottom frame, Voltage-sensitive dye fluorescence image of the soma–axon region with the AIS, first and second nodes as indicated. Colored frames, A time sequence of color-coded spatial map of relative membrane potential during initiation of AP shown in C. Signals from detectors centered over the main axon and collaterals are shown. The color scale is in relative units with resting membrane potential shown in blue/green, half-maximum amplitude in red, and peak of the AP in yellow. Individual frames are separated by 50 μs (obtained from cubic spline interpolation of original data points recorded at 100 μs intervals) (Fig. 2_B_). At ∼50 μs, the spike initiated in the AIS and propagated down the axon. At ∼100 μs, the first node was discharged to half-maximum amplitude before the immediately adjacent axonal regions. At ∼200 μs, the region of the second axon collateral (second node) is approaching half-maximal. B, A time sequence of changing spatial profiles of membrane potential during initiation and propagation of an action potential. The spatial plots constructed by dividing the axon into 20 regions of equal length. The average relative voltage for each region plotted as a function of distance from the soma. The time of each spatial plot in the sequence corresponds to time points indicated for color-coded frames in A. Note how the action potential propagates from the AIS to the first node, then to the second node, followed by propagation into the internodal regions. C, A temporal average of 26 spontaneous action potentials for the AIS, first node, and second node with time lines corresponding to the data in A and B. See also supplemental Movie 3 and supplemental Figure 4 (available at
as supplemental material).
Figure 5.
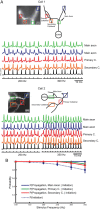
Propagation of simple spikes into axon collaterals. A, Voltage-sensitive dye fluorescence image of a section of the axon arbor in recording position (top left). The spatial relationship with the soma is shown schematically on the right. Recordings from four locations indicated in the image are shown below. The bottom traces (black) indicate stimulus current and electrode recordings from the soma. Simple spikes evoked by trains of repetitive current pulses injected into the soma at 200–250 Hz reliably propagate in the main axon (green and blue traces), primary (red) collaterals, and secondary collaterals (orange). At 300–350 Hz, action potentials sometimes fail to initiate in one Purkinje cell (cell 1) but not in the other (cell 2). B, Probability of initiation of simple spikes in the main axon (blue, dashed line), as well as the probability of propagation of these spikes, once initiated, down the main axon (blue) and primary (green) and secondary (red) collaterals as a function of stimulation frequency (n = 6 neurons). During simple spike activity, all action potentials that were initiated propagated down the main axon and only rarely did these spikes fail to invade the primary and secondary axon collaterals. See supplemental Figure 3 (available at
as supplemental material). Error bars indicate SEM.
Figure 6.
Action potentials show variable propagation probabilities during complex spikes. A, Voltage-sensitive dye fluorescence image of the soma–axon region in recording position shown on the left. Top trace on the right (black), Timing of climbing fiber activation by extracellular electrical stimulation. Second trace (black), Whole-cell somatic recording. Bottom color traces, Optical recordings of AP signals, evoked with climbing fiber stimulation, from 12 locations indicated on the image. Each trace is a temporal average of 18 trials and a spatial average of 6–8 pixels. Signals are scaled so that the first AP is of the same height. B, C, Action potential onset latency, measured from the time to half-maximum amplitude, as a function of distance from the edge of the soma for the first sodium spike (thin trace) and subsequent spikelets (red and blue traces) for a Purkinje cell (B) and average group data (C). In both cases, the first spikelet fails to propagate at 30–60 μm, before the first branch point. D, Relative amplitude (proportion of amplitude of the first and second spikelets) versus distance from the soma. Note that the first spikelet continuously decreases, whereas the second spikelet decreases and then increases in amplitude. The first spikelet amplitude was measured as the peak membrane potential at 0.5–3 ms after the first spike, whereas the second spikelet amplitude was measured as the peak membrane potential at 3–10 ms after the first spike (see Materials and Methods). The bottom data points represent baseline noise before initiation of a complex spike. The dashed line (spikelet 1 without failures) represents the average response after excluding two trials in which the first spikelet propagated successfully down the main axon. E, Group data (n = 5) demonstrating the general property of the first spikelet to decrease over the first 100 μm of the axon, whereas the amplitude of the second spikelet often decreases and then increases with distance from the soma, indicating active propagation. The bottom data points represent average baseline data points before spike initiation. The peak amplitude of each spikelet contains in part the underlying membrane potential change because of activation of either the previous spike or the slow depolarization of the complex spike (this is particularly true of sites near the soma). In all cells, the first spikelet decayed to 30% or less of its amplitude at initiation within 100 μm of the soma. All trials are included. See supplemental Figure 5 (available at
as supplemental material) for the point of spikelet failures for individual neurons. Error bars indicate SEM.
Figure 7.
A, Voltage-sensitive dye fluorescence image of the axonal section containing a primary and a secondary branch in recording position. The spatial relationship with the soma is shown schematically in the bottom left panel. B, Electrical (soma; black) and optical recordings of the complex spike signals from locations on the main axon before (black) and after (red) the branch point as well as the membrane potential in the primary (green) and secondary (orange) axon collaterals indicated in the schematic. Top trace (black), Timing of electrical stimulation of the climbing fiber. In this experiment, the first spike reliably propagates throughout the main axon and axon collaterals. The first spikelet failed to propagate into the primary collateral, and subsequent spikelets propagated with intermediate probability. C, Summary data showing propagation probability for the initial spike (1), first spikelet (2), and second spikelet (3) comprising complex spikes evoked with climbing fiber stimulation (n = 6 cells). Propagation probability for each component of the complex spike was identical for the main axon after the axon collateral branch point and for axon collaterals. Error bars indicate SEM.
Similar articles
- The origin of the complex spike in cerebellar Purkinje cells.
Davie JT, Clark BA, Häusser M. Davie JT, et al. J Neurosci. 2008 Jul 23;28(30):7599-609. doi: 10.1523/JNEUROSCI.0559-08.2008. J Neurosci. 2008. PMID: 18650337 Free PMC article. - Initiation of simple and complex spikes in cerebellar Purkinje cells.
Palmer LM, Clark BA, Gründemann J, Roth A, Stuart GJ, Häusser M. Palmer LM, et al. J Physiol. 2010 May 15;588(Pt 10):1709-17. doi: 10.1113/jphysiol.2010.188300. Epub 2010 Mar 29. J Physiol. 2010. PMID: 20351049 Free PMC article. - Determinants of action potential propagation in cerebellar Purkinje cell axons.
Monsivais P, Clark BA, Roth A, Häusser M. Monsivais P, et al. J Neurosci. 2005 Jan 12;25(2):464-72. doi: 10.1523/JNEUROSCI.3871-04.2005. J Neurosci. 2005. PMID: 15647490 Free PMC article. - Climbing fibers mediate vestibular modulation of both "complex" and "simple spikes" in Purkinje cells.
Barmack NH, Yakhnitsa V. Barmack NH, et al. Cerebellum. 2015 Oct;14(5):597-612. doi: 10.1007/s12311-015-0725-1. Cerebellum. 2015. PMID: 26424151 Review. - Beyond a Transmission Cable-New Technologies to Reveal the Richness in Axonal Electrophysiology.
Mateus JC, Sousa MM, Burrone J, Aguiar P. Mateus JC, et al. J Neurosci. 2024 Mar 13;44(11):e1446232023. doi: 10.1523/JNEUROSCI.1446-23.2023. J Neurosci. 2024. PMID: 38479812 Free PMC article. Review.
Cited by
- Supertemporal Resolution Imaging of Membrane Potential via Stroboscopic Microscopy.
Peng L, Zou P. Peng L, et al. Chem Biomed Imaging. 2023 Jul 20;1(5):448-460. doi: 10.1021/cbmi.3c00054. eCollection 2023 Aug 28. Chem Biomed Imaging. 2023. PMID: 39473935 Free PMC article. - Spike transmission failures in axons from cortical neurons in vivo.
Ofer N, Cornejo VH, Yuste R. Ofer N, et al. iScience. 2024 Sep 5;27(10):110884. doi: 10.1016/j.isci.2024.110884. eCollection 2024 Oct 18. iScience. 2024. PMID: 39346673 Free PMC article. - Activity-Dependent Remodeling of Corticostriatal Axonal Boutons During Motor Learning.
Sheng M, Lu D, Sheng K, Ding JB. Sheng M, et al. bioRxiv [Preprint]. 2024 Jun 10:2024.06.10.598366. doi: 10.1101/2024.06.10.598366. bioRxiv. 2024. PMID: 38915677 Free PMC article. Preprint. - High-speed optical imaging with sCMOS pixel reassignment.
Mandracchia B, Zheng C, Rajendran S, Liu W, Forghani P, Xu C, Jia S. Mandracchia B, et al. Nat Commun. 2024 May 30;15(1):4598. doi: 10.1038/s41467-024-48987-7. Nat Commun. 2024. PMID: 38816394 Free PMC article. - Spike transmission failures in axons from mouse cortical pyramidal neurons in vivo.
Ofer N, Cornejo VH, Yuste R. Ofer N, et al. bioRxiv [Preprint]. 2024 Jan 30:2024.01.29.577733. doi: 10.1101/2024.01.29.577733. bioRxiv. 2024. PMID: 38352485 Free PMC article. Updated. Preprint.
References
- Aizenman CD, Linden DJ. Regulation of the rebound depolarization and spontaneous firing patterns of deep nuclear neurons in slices of rat cerebellum. J Neurophysiol. 1999;82:1697–1709. - PubMed
- Antic S, Major G, Zecevic D. Fast optical recordings of membrane potential changes from dendrites of pyramidal neurons. J Neurophysiol. 1999;82:1615–1621. - PubMed
- Bloedel JR, Roberts WJ. Action of climbing fibers in cerebellar cortex of the cat. J Neurophysiol. 1971;34:17–31. - PubMed
- Blunck R, Chanda B, Bezanilla F. Nano to micro—fluorescence measurements of electric fields in molecules and genetically specified neurons. J Membr Biol. 2005;208:91–102. - PubMed
Publication types
MeSH terms
Substances
Grants and funding
- R01 NS068407/NS/NINDS NIH HHS/United States
- R01 NS068407-01/NS/NINDS NIH HHS/United States
- R01 NS060135/NS/NINDS NIH HHS/United States
- R01 NS060135-04/NS/NINDS NIH HHS/United States
- R01 NS068407-02/NS/NINDS NIH HHS/United States
LinkOut - more resources
Full Text Sources
Other Literature Sources
Molecular Biology Databases

