G2 phase chromatin lacks determinants of replication timing - PubMed (original) (raw)
G2 phase chromatin lacks determinants of replication timing
Junjie Lu et al. J Cell Biol. 2010.
Abstract
DNA replication in all eukaryotes follows a defined replication timing program, the molecular mechanism of which remains elusive. Using a Xenopus laevis egg extract replication system, we previously demonstrated that replication timing is established during early G1 phase of the cell cycle (timing decision point [TDP]), which is coincident with the repositioning and anchorage of chromatin in the newly formed nucleus. In this study, we use this same system to show that G2 phase chromatin lacks determinants of replication timing but maintains the overall spatial organization of chromatin domains, and we confirm this finding by genome-wide analysis of rereplication in vivo. In contrast, chromatin from quiescent cells retains replication timing but exhibits disrupted spatial organization. These data support a model in which events at the TDP, facilitated by chromatin spatial organization, establish determinants of replication timing that persist independent of spatial organization until the process of chromatin replication during S phase erases those determinants.
Figures
Figure 1.
Generalized protocol. (A) In vivo synchronization is shown. The protocols used in Figs. 2–5 all begin with the prelabeling of cells in early or late S phase with EdU. To synchronize cells in G2 phase, cells were first synchronized in mitosis by shake off and pulse labeled in either early (∼10 h after M phase) or late (∼18 h after M phase) S phase with EdU. At ∼20 h after mitosis, cells were pulse labeled with BrdU to identify any cells still in late S phase and collected. To make G1 phase controls, aliquots of G2 phase cells were allowed to proceed into mitosis; mitotic cells were then collected by shake off and released into the following G1 phase for 1 (pre-TDP) or 3 h (post-TDP). To prepare cells in G0, asynchronously growing cells were labeled with EdU and chased for 5 (EdU label in late S phase) or 12 h (EdU label in early S phase). Mitotic cells were isolated and released into serum-free medium for 96 h and pulse labeled with BrdU before collection to identify any remaining proliferating cells. (B) In vitro rereplication is shown. Nuclei from each of the cell preparations in A were introduced into a Xenopus egg extract. In some reactions, the total level of DNA synthesis per nucleus was monitored by incorporation of digoxigenin-dUTP (not depicted). To evaluate replication timing, reactions were pulse labeled with biotin-dUTP for 5 min at 30 (early), 60 (middle), or 120 min (late) in vitro. (C) Staining is shown. Biotin incorporation in nuclei from the reactions in B was colocalized to either the sites of early and late DNA synthesis labeled in vivo or to specific chromosomal sites of interest.
Figure 2.
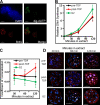
Asynchronous rereplication of chromocenters in G2 phase. (A) Geminin prevents in vitro replication of G2 phase chromatin. G2 phase nuclei from mouse C127 cells synchronized and prelabeled with BrdU as described in Fig. 1 were introduced into a Xenopus egg extract supplemented with geminin and digoxigenin-dUTP for 120 min. Nuclei were stained with fluorescent anti-BrdU (red) and anti-dig (green) antibodies, and DNA was counterstained with DAPI (blue). BrdU-positive nuclei (still in S phase at the time of collection) incorporated digoxigenin-dUTP as a result of elongation of preexisting forks, but no initiation of replication was observed within G2 phase nuclei. (B) Replication proceeds efficiently within G1 and G2 phase nuclei. Nuclei prepared as described in Fig. 1 A were introduced into a Xenopus egg extract supplemented with digoxigenin-dUTP. Aliquots were removed at the indicated times, and nuclei were stained with fluorescent anti-dig (and for G2 phase nuclei anti-BrdU) antibodies. The incorporation of digoxigenin-dUTP per (BrdU negative) nucleus was quantified using an imaging system with softWoRx and normalized to the lowest value for all nuclei in all preparations. n > 30 nuclei per condition/time point (arbitrary units). Note that G2 phase nuclei incorporate 40% more digoxigenin-UTP. Because there is twice as much DNA in G2 phase nuclei, the efficiency of replication is ∼70% that of G1 phase. (C) Chromocenters are preferentially replicated late only in post-TDP nuclei. Nuclei prepared as described in Fig. 1 A were introduced into a Xenopus egg extract, and aliquots were removed and pulse labeled for 5 min with biotin-dUTP at the indicated times. Nuclei were stained with fluorescent avidin to highlight incorporated biotin, and chromocenters were identified as sites of intense DAPI staining. G2 phase nuclei were additionally stained with anti-BrdU antibodies as in A. Colocalization between chromocenters and in vitro biotin labeling was quantified using softWoRx. Pre-TDP and G2 phase nuclei showed a similar amount of colocalization throughout the in vitro reaction, whereas post-TDP nuclei showed significantly more chromocenter replication late in the reaction (120 min). n > 50 nuclei/condition/time point. (D) Exemplary images of individual pre-TDP, post-TDP, and G2 phase nuclei from C fixed and stained at different time points during the in vitro reaction. Colocalization between chromocenters (DAPI-dense regions in blue) and in vitro biotin-dUTP pulse labeling (red) are highlighted in white. For G2 phase, only BrdU-negative nuclei were analyzed. Note that the post-TDP 120-min nucleus shows considerably more pixels colocalized with chromocenters than other nuclei. Error bars indicate mean ± SD. Bars, 5 µm.
Figure 3.
Global rereplication in G2 phase does not follow a specific temporal order. (A) Nuclei from mouse C127 cells prelabeled and synchronized in G1 or G2 phase as in Fig. 2 were introduced into a Xenopus egg extract and pulse labeled with biotin-dUTP. Nuclei were stained with fluorescent avidin to highlight incorporated biotin, fluorescent azide to highlight sites of early and late replication (EdU) from the prior S phase, and anti-BrdU antibodies to identify contaminating S phase cells. Images were collected and subjected to deconvolution using DeltaVision. Exemplary images of G2 phase (BrdU negative) nuclei or G1 phase control nuclei pulse labeled in vitro at either 30 (in vitro early) or 120 min (in vitro late) are shown. Merged images highlight areas of EdU and biotin colocalization as white pixels. Note the similar level of colocalization among all nuclei for G2 phase and pre-TDP G1 phase, indicating lack of temporal specificity, whereas post-TDP nuclei show colocalization in the proper temporal order (C). (B–D) Quantification of EdU and biotin-dUTP colocalization for G2 phase (B), pre-TDP (C), and post-TDP (D) G1 phase nuclei from the experiments described in A. Colocalization between in vivo early (black) or late (red) S phase EdU label and biotin-dUTP label incorporated at the indicated times during the in vitro reaction was quantified as in Fig. 2. Both pre-TDP and G2 phase nuclei showed similar colocalization throughout the in vitro reaction. Mean ± SD of n > 50 nuclei/condition/time point is shown. Bars, 5 µm.
Figure 4.
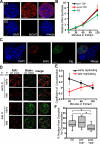
Quiescent cells retain a replication timing program. (A) Immunostaining of Mcm7 in normal proliferating G1 phase and quiescent (G0) C127 cells, confirming the loss of Mcm chromatin binding (red, Mcm7; blue, DAPI). (B) Replication proceeds efficiently within G1 and G0 nuclei. Nuclei were introduced into a Xenopus egg extract supplemented with digoxigenin-dUTP, and the incorporation of digoxigenin-dUTP per nucleus was quantified as in Fig. 2 A. n > 30 nuclei/condition/time point. (C) Geminin prevents in vitro replication of G0 chromatin. G0 nuclei were introduced into a Xenopus egg extract supplemented with geminin and digoxigenin-dUTP for 120 min. As in Fig. 2 A, only the few contaminating BrdU-positive nuclei (still proliferating at the time of collection) incorporated digoxigenin-dUTP as a result of elongation of preexisting forks, but no initiation of replication was observed within G0 nuclei. (D and E) G0 nuclei were introduced into a Xenopus egg extract, pulse labeled for 5 min with biotin-dUTP at the indicated times, and stained as in Fig. 3 (B–D). Colocalization between in vivo early (black) or late (red) S phase EdU label and biotin-dUTP label was quantified as in Fig. 3. Exemplary images (D) and quantification (E) showed that early- and late-replicating sequences labeled in vivo with EdU are replicated in their proper temporal order in vitro. n > 50 nuclei per condition/time point. (F) Cells synchronized in G0 or G1 phase were subjected to DNA-FISH using a major satellite probe to specifically label chromocenters. The area occupied by chromocenters was quantified using softWoRx. Box plots of at least 50 nuclei/sample are shown. The boundary of each box closest to zero indicates the 25th percentile, a line within the box marks the median, and the boundary of the box farthest from zero indicates the 75th percentile. Whiskers above and below the box indicate the 90th and 10th percentiles, respectively. Asterisks indicate statistically significant differences (Student-Newman-Keuls method). Error bars indicate mean ± SD. Bars, 5 µm.
Figure 5.
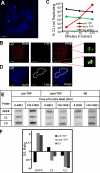
Massive decondensation of a heterochromatic locus in quiescence with retention of replication timing. (A) A mitotic spread prepared from CHO cells and subjected to DNA-FISH with C3 probe. C3 was shown to be on chromosome 1 as a single-copy locus. (B) Similar to Fig. 2, nuclei from G2 phase, pre-TDP, and post-TDP G1 phase (not depicted) CHO cells were introduced into a Xenopus egg extract and pulse labeled with biotin-dUTP. Nuclei were stained with fluorescent avidin to highlight incorporated biotin and DNA-FISH for C3 locus. Images were collected and processed as in Fig. 2. Images of one G2 phase (BrdU negative) nucleus with four copies of C3 and pulse labeled in vitro at 120 min are shown. Colocalized C3 DNA-FISH signal and in vitro biotin-dUTP pixels are shown in white. Areas covering two of the four C3 loci are magnified (insets) to show the different levels of colocalization. (C) Quantification of C3 in vitro replication. Percentages of C3 DNA-FISH foci engaging in in vitro replication (colocalizing with biotin-dUTP) were quantified from the nuclei prepared in B. Only post-TDP nuclei preferably replicated C3 late in the reaction. n > 50 nuclei/condition/time point. Note that in both pre-TDP and G2 phase nuclei, most C3 loci replicate throughout the reaction, indicating that segments of the 3-Mb locus must replicate at different times within the same nuclei. The lower percent for G2 phase nuclei is consistent with a slightly lower efficiency of replication within these nuclei (Fig. 2 B). (D) C3 underwent decondensation in quiescent cells. C3 DNA-FISH to quiescent CHO cells did not detect clear individual signals. Dashed circles denote areas covered by C3 loci in this nucleus. (E) Permeable pre-TDP, post-TDP, or G0 nuclei were introduced into Xenopus egg extract. Replication intermediates were pulse labeled with α-[32P]dATP either at early (E; 0–30 min) or late (L; 110–120 min) in vitro reaction. Radiolabeled DNA was purified and hybridized to hamster DNA sequences, including DHFR (early replicating), C1 (middle/late replicating), and C3 (late replicating). Note that this assay is not applicable to G2 phase because of unavoidable S phase contamination in G2 phase population. (F) The relative cpm hybridized to the three probes was quantified. Early to late ratios of each probe were calculated for each cell preparation and plotted, showing similar ratios for post-TDP (gray bars) and G0 (stripe bars) but not pre-TDP (black bars). Bars, 5 µm.
Figure 6.
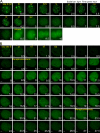
Live cell imaging of PCNA dynamics during a rereplication S phase. (A) C127 cells stably expressing GFP-PCNA were followed by a time-lapse live cell imaging microscope every 30 min. Without any drug treatment, GFP-PCNA went through normal spatial–temporal replication patterns. A cell is shown proceeding from late S phase chromocenter replication (pattern IV for C127 cells) to peripheral replication (pattern V), then to a few unfinished regions (pattern VI), finally to G2, M, and early G1 phase of the next cell cycle. PCNA patterns in C127 cells were classified as described previously (Lu and Gilbert, 2007). The contrast was increased for hours 8.5–10 so that the cell morphology is more visible. (B) GFP-PCNA–expressing C127 cells were treated with 6 µM RO3306 and followed for 20–30 h. A cell in very late S phase (pattern VI) is shown at the time of drug addition that entered G2 phase (GFP-PCNA negative) and initiated a second round of DNA replication shortly thereafter. There were no recognizable GFP-PCNA patterns throughout the ∼20-h-long rereplication S phase, although the spatial distribution of the few foci at the very end of either normal or rereplication S phase is hard to distinguish. Bars, 5 µm.
Figure 7.
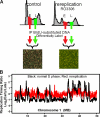
Genome-wide analysis of replication timing. (A) Protocol for replication timing profiling. Asynchronously growing control C127 cells or C127 cells treated with 6 µM RO3306 for 20 h were BrdU labeled and FACS sorted into early (E) and late (L) fractions of normal S phase or rereplication S phase. Nascent BrdU-substituted DNA was immunoprecipitated (IP) using BrdU antibodies and hybridized to mouse comparative genomic hybridization arrays with probes every 5.8 kb. (B) Normalized and smoothed replication timing profiles of normal S phase (black) and rereplication (red) were overlayed. A segment of mouse chromosome 1 (3–50 Mb) is shown. Similar results were obtained in two replicate experiments. All datasets are available to view or download at
http://www.replicationdomain.org
(Weddington et al., 2008).
Figure 8.
A working model for initiation and maintenance of RTDs during cell cycle. In this model, early- and late-replicating chromatin domains are labeled as red or green, respectively, with light colors representing lack of RTDs and bright colors representing the presence of RTDs. Because replication timing and spatial organization of chromatin are established simultaneously during early G1 phase at the TDP (Dimitrova and Gilbert, 1999) and because there is a strong genome-wide correlation between 3D chromosome architecture and replication timing (Ryba et al., 2010), it is hypothesized that spatial reorganization at the TDP drives the assembly of RTDs potentially by creating subnuclear compartments that set thresholds for initiation of replication (for review see Gilbert, 2001). These RTDs are maintained until the time of replication in S phase. During replication, the potential RTDs are modified or removed at the replication fork, indicated by early-replicating domains changing to light colors first, followed by late-replicating domains. In G2 phase, there are no RTDs on chromatin, but the general spatial organization is maintained until being disrupted during mitosis. If cells withdraw from the cell cycle and enter quiescence, the spatial organization of chromatin changes, but RTDs remain intact, and upon return to the cell cycle, replication proceeds in the normal temporal order despite spatial disruption. Because replication timing and presumably 3D architecture are maintained from one cell cycle to the next, some memory must persist through mitosis to reestablish this program at each TDP. However, dismantling and reassembling higher order chromosome architecture could also provide a window of opportunity in which to reprogram 3D architecture and replication timing to influence cellular identity in response to extracellular cues during differentiation. N, nucleolus; S, S phase.
Similar articles
- Recombinant Cdt1 induces rereplication of G2 nuclei in Xenopus egg extracts.
Maiorano D, Krasinska L, Lutzmann M, Mechali M. Maiorano D, et al. Curr Biol. 2005 Jan 26;15(2):146-53. doi: 10.1016/j.cub.2004.12.002. Curr Biol. 2005. PMID: 15668171 - Nuclear proteins of quiescent Xenopus laevis cells inhibit DNA replication in intact and permeabilized nuclei.
Fang J, Benbow RM. Fang J, et al. J Cell Biol. 1996 Jun;133(5):955-69. doi: 10.1083/jcb.133.5.955. J Cell Biol. 1996. PMID: 8655587 Free PMC article. - Replication fork density increases during DNA synthesis in X. laevis egg extracts.
Herrick J, Stanislawski P, Hyrien O, Bensimon A. Herrick J, et al. J Mol Biol. 2000 Jul 28;300(5):1133-42. doi: 10.1006/jmbi.2000.3930. J Mol Biol. 2000. PMID: 10903859 - Chromatin structure and replication origins: determinants of chromosome replication and nuclear organization.
Smith OK, Aladjem MI. Smith OK, et al. J Mol Biol. 2014 Oct 9;426(20):3330-41. doi: 10.1016/j.jmb.2014.05.027. Epub 2014 Jun 4. J Mol Biol. 2014. PMID: 24905010 Free PMC article. Review. - Initiation of DNA replication in Xenopus egg extracts.
Arias EE, Walter JC. Arias EE, et al. Front Biosci. 2004 Sep 1;9:3029-45. doi: 10.2741/1457. Front Biosci. 2004. PMID: 15353335 Review.
Cited by
- Oxidative replication stress induced by long-term exposure to hydroxyurea in root meristem cells of Vicia faba.
Żabka A, Gocek N, Polit JT, Maszewski J. Żabka A, et al. Plant Cell Rep. 2024 Mar 9;43(4):87. doi: 10.1007/s00299-024-03187-x. Plant Cell Rep. 2024. PMID: 38460026 - Replication timing and transcriptional control: beyond cause and effect - part IV.
Vouzas AE, Gilbert DM. Vouzas AE, et al. Curr Opin Genet Dev. 2023 Apr;79:102031. doi: 10.1016/j.gde.2023.102031. Epub 2023 Mar 9. Curr Opin Genet Dev. 2023. PMID: 36905782 Free PMC article. Review. - Low Replicative Stress Triggers Cell-Type Specific Inheritable Advanced Replication Timing.
Courtot L, Bournique E, Maric C, Guitton-Sert L, Madrid-Mencía M, Pancaldi V, Cadoret JC, Hoffmann JS, Bergoglio V. Courtot L, et al. Int J Mol Sci. 2021 May 7;22(9):4959. doi: 10.3390/ijms22094959. Int J Mol Sci. 2021. PMID: 34066960 Free PMC article. - Control of DNA replication timing in the 3D genome.
Marchal C, Sima J, Gilbert DM. Marchal C, et al. Nat Rev Mol Cell Biol. 2019 Dec;20(12):721-737. doi: 10.1038/s41580-019-0162-y. Epub 2019 Sep 2. Nat Rev Mol Cell Biol. 2019. PMID: 31477886 Free PMC article. Review. - Rapid Irreversible Transcriptional Reprogramming in Human Stem Cells Accompanied by Discordance between Replication Timing and Chromatin Compartment.
Dileep V, Wilson KA, Marchal C, Lyu X, Zhao PA, Li B, Poulet A, Bartlett DA, Rivera-Mulia JC, Qin ZS, Robins AJ, Schulz TC, Kulik MJ, McCord RP, Dekker J, Dalton S, Corces VG, Gilbert DM. Dileep V, et al. Stem Cell Reports. 2019 Jul 9;13(1):193-206. doi: 10.1016/j.stemcr.2019.05.021. Epub 2019 Jun 20. Stem Cell Reports. 2019. PMID: 31231024 Free PMC article.
References
Publication types
MeSH terms
Substances
LinkOut - more resources
Full Text Sources
Other Literature Sources
Research Materials

