Survival in critical illness is associated with early activation of mitochondrial biogenesis - PubMed (original) (raw)
Clinical Trial
. 2010 Sep 15;182(6):745-51.
doi: 10.1164/rccm.201003-0326OC. Epub 2010 Jun 10.
Jean-Christophe Orban, Lorenza Re, Karen Felsmann, Wiebke Iffert, Michael Bauer, Hagir B Suliman, Claude A Piantadosi, Terry M Mayhew, Patrick Breen, Martin Stotz, Mervyn Singer
Affiliations
- PMID: 20538956
- PMCID: PMC2949402
- DOI: 10.1164/rccm.201003-0326OC
Clinical Trial
Survival in critical illness is associated with early activation of mitochondrial biogenesis
Jane E Carré et al. Am J Respir Crit Care Med. 2010.
Abstract
Rationale: We previously reported outcome-associated decreases in muscle energetic status and mitochondrial dysfunction in septic patients with multiorgan failure. We postulate that survivors have a greater ability to maintain or recover normal mitochondrial functionality.
Objectives: To determine whether mitochondrial biogenesis, the process promoting mitochondrial capacity, is affected in critically ill patients.
Methods: Muscle biopsies were taken from 16 critically ill patients recently admitted to intensive care (average 1-2 d) and from 10 healthy, age-matched patients undergoing elective hip surgery.
Measurements and main results: Survival, mitochondrial morphology, mitochondrial protein content and enzyme activity, mitochondrial biogenesis factor mRNA, microarray analysis, and phosphorylated (energy) metabolites were determined. Ten of 16 critically ill patients survived intensive care. Mitochondrial size increased with worsening outcome, suggestive of swelling. Respiratory protein subunits and transcripts were depleted in critically ill patients and to a greater extent in nonsurvivors. The mRNA content of peroxisome proliferator-activated receptor γ coactivator 1-α (transcriptional coactivator of mitochondrial biogenesis) was only elevated in survivors, as was the mitochondrial oxidative stress protein manganese superoxide dismutase. Eventual survivors demonstrated elevated muscle ATP and a decreased phosphocreatine/ATP ratio.
Conclusions: Eventual survivors responded early to critical illness with mitochondrial biogenesis and antioxidant defense responses. These responses may partially counteract mitochondrial protein depletion, helping to maintain functionality and energetic status. Impaired responses, as suggested in nonsurvivors, could increase susceptibility to mitochondrial damage and cellular energetic failure or impede the ability to recover normal function. Clinical trial registered with clinical trials.gov (NCT00187824).
Figures
Figure 1.
Ultrastructural features of muscles and their mitochondria. (A) Control muscle showing well-aligned sarcomeres with well-defined A, I, and M bands and Z lines. Clusters of dense mitochondria are seen between fibers. (B and C) Muscle from a sepsis survivor showing focal breakdown of muscle morphology with loss of sarcomere structural integrity and swollen or damaged mitochondria. (D and E) Muscle from a nonsurvivor showing that mitochondrial changes affect the subsarcolemmal and interfiber regions. Bar = 2 μm in all cases.
Figure 2.
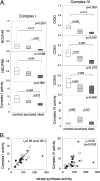
Respiratory chain protein subunits and complex activities in critical illness. (A) Analysis of respiratory chain subunits and activities for Complex I (NADH dehydrogenase complex) and Complex IV (cytochrome c oxidase complex). Protein content of subunits NDUFA9, NDUFB8 and COX1, COX2, and COX4 was determined by immunoblotting and expressed semiquantitatively as pixel density relative to an internal standard, normalized to total protein stain. Sample blots are shown in Figure E1. Complex I activity is expressed as nmol NADH/min/mg protein; Complex IV is expressed as a first-order rate constant for cytochrome c (1/min/mg protein). Data are shown as median, 25th, and 75th percentiles with range (dotted line) from 9 control patients, 9 or 10 survivors, and 5 or 6 nonsurvivors. (B) Relationship of respiratory complex activities (Complexes I and IV) with citrate synthase activity (nmol/min/mg protein). Open circles, control subjects; gray diamonds, survivors; closed squares, nonsurvivors.
Figure 3.
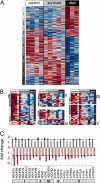
Microarray analysis of muscle biopsies from critically ill patients versus control patients. (A) Heatmap depicting the bead-types (875 transcripts) with a mean fold-change greater than 1.5 between survivor and nonsurvivor, showing an overall P value < 0.05 (one-way analysis of variance). Red indicates increase in transcript abundance; blue indicates decrease, relative to the overall mean value (white). Details of biostatistics may be found in the online supplement. (B) Heatmaps showing relative expression of transcripts encoding subunits of OXPHOS I through V in muscle biopsies from different patient groups. I, NADH ubiquinone oxidoreductase complex; II, succinate Complexes dehydrogenase complex (includes nine bead-types for SDH-like protein SDHALP1); III, ubiquinol-cytochrome c oxidoreductase complex; IV, cytochrome c oxidase; V, ATP synthase. Mitochondrially encoded subunits were not measured. (C) Histogram showing OXPHOS transcripts meeting the set thresholds for P value and fold-change. Black bars, survivor versus nonsurvivor; light gray bars, survivor versus control; red bars, nonsurvivor versus control. Horizontal dotted lines represent the 1.5-fold change threshold. Data represent biopsies from four control subjects, five survivors, and three nonsurvivors.
Figure 4.
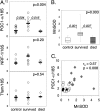
Changes in critical illness of the mitochondrial biogenesis factors peroxisome proliferator-activated receptor γ coactivator 1-α (PGC-1α), nuclear respiratory factor-1 (NRF-1), and mitochondrial transcription factor-A (TFAM) and the mitochondrial oxidative stress protein manganese superoxide dismutase (MnSOD). (A) Transcript abundance for PGC-1α, NRF-1, and TFAM, normalized to content of 18S rRNA; median, 25th and 75th percentile and range for biopsies from 10 control patients, 9 survivors, 3 nonsurvivors. (B) Semiquantitative analysis of MnSOD (SOD2) protein from immunoblots, expressed semiquantitatively as pixel density relative to an internal standard, normalized to total protein stain. Median plus 25th and 75th percentile and range for biopsies from 10 control patients, 10 survivors, and 6 nonsurvivors. (C) Positive association between MnSOD protein and PGC-1α mRNA. Control (open circles), survivors (gray diamonds), nonsurvivors (closed squares).
Comment in
- Peroxisome proliferator-activated receptors gamma coactivator-1alpha: master regulator of mitochondrial biogenesis and survival during critical illness?
Crouser ED. Crouser ED. Am J Respir Crit Care Med. 2010 Sep 15;182(6):726-8. doi: 10.1164/rccm.201005-0695ED. Am J Respir Crit Care Med. 2010. PMID: 20833826 No abstract available.
Similar articles
- Dysregulation of mitochondrial dynamics and the muscle transcriptome in ICU patients suffering from sepsis induced multiple organ failure.
Fredriksson K, Tjäder I, Keller P, Petrovic N, Ahlman B, Schéele C, Wernerman J, Timmons JA, Rooyackers O. Fredriksson K, et al. PLoS One. 2008;3(11):e3686. doi: 10.1371/journal.pone.0003686. Epub 2008 Nov 10. PLoS One. 2008. PMID: 18997871 Free PMC article. - Mitochondrial fusion, fission, and biogenesis in prolonged critically ill patients.
Vanhorebeek I, Gunst J, Derde S, Derese I, Boussemaere M, D'Hoore A, Wouters PJ, Van den Berghe G. Vanhorebeek I, et al. J Clin Endocrinol Metab. 2012 Jan;97(1):E59-64. doi: 10.1210/jc.2011-1760. Epub 2011 Oct 19. J Clin Endocrinol Metab. 2012. PMID: 22013100 Clinical Trial. - Failed upregulation of TFAM protein and mitochondrial DNA in oxidatively deficient fibers of chronic obstructive pulmonary disease locomotor muscle.
Konokhova Y, Spendiff S, Jagoe RT, Aare S, Kapchinsky S, MacMillan NJ, Rozakis P, Picard M, Aubertin-Leheudre M, Pion CH, Bourbeau J, Hepple RT, Taivassalo T. Konokhova Y, et al. Skelet Muscle. 2016 Feb 18;6:10. doi: 10.1186/s13395-016-0083-9. eCollection 2016. Skelet Muscle. 2016. PMID: 26893822 Free PMC article. - The Role of Exercise and TFAM in Preventing Skeletal Muscle Atrophy.
Theilen NT, Kunkel GH, Tyagi SC. Theilen NT, et al. J Cell Physiol. 2017 Sep;232(9):2348-2358. doi: 10.1002/jcp.25737. Epub 2017 Apr 12. J Cell Physiol. 2017. PMID: 27966783 Free PMC article. Review. - Alterations in the mitochondrial regulatory pathways constituted by the nuclear co-factors PGC-1alpha or PGC-1beta and mitofusin 2 in skeletal muscle in type 2 diabetes.
Zorzano A, Hernández-Alvarez MI, Palacín M, Mingrone G. Zorzano A, et al. Biochim Biophys Acta. 2010 Jun-Jul;1797(6-7):1028-33. doi: 10.1016/j.bbabio.2010.02.017. Epub 2010 Feb 20. Biochim Biophys Acta. 2010. PMID: 20175989 Review.
Cited by
- Biomarkers in sepsis.
Singer M. Singer M. Curr Opin Pulm Med. 2013 May;19(3):305-9. doi: 10.1097/MCP.0b013e32835f1b49. Curr Opin Pulm Med. 2013. PMID: 23411577 Free PMC article. Review. - Antioxidant strategies in neurocritical care.
Hanafy KA, Selim MH. Hanafy KA, et al. Neurotherapeutics. 2012 Jan;9(1):44-55. doi: 10.1007/s13311-011-0085-6. Neurotherapeutics. 2012. PMID: 22135010 Free PMC article. Review. - Heparin-based blood purification attenuates organ injury in baboons with Streptococcus pneumoniae pneumonia.
Chen L, Kraft BD, Roggli VL, Healy ZR, Woods CW, Tsalik EL, Ginsburg GS, Murdoch DM, Suliman HB, Piantadosi CA, Welty-Wolf KE. Chen L, et al. Am J Physiol Lung Cell Mol Physiol. 2021 Aug 1;321(2):L321-L335. doi: 10.1152/ajplung.00337.2020. Epub 2021 Jun 9. Am J Physiol Lung Cell Mol Physiol. 2021. PMID: 34105359 Free PMC article. - The Sick and the Weak: Neuropathies/Myopathies in the Critically Ill.
Friedrich O, Reid MB, Van den Berghe G, Vanhorebeek I, Hermans G, Rich MM, Larsson L. Friedrich O, et al. Physiol Rev. 2015 Jul;95(3):1025-109. doi: 10.1152/physrev.00028.2014. Physiol Rev. 2015. PMID: 26133937 Free PMC article. Review. - The surviving sepsis campaign: basic/translational science research priorities.
Deutschman CS, Hellman J, Roca RF, De Backer D, Coopersmith CM; Research Committee of the Surviving Sepsis Campaign. Deutschman CS, et al. Intensive Care Med Exp. 2020 Jul 17;8(1):31. doi: 10.1186/s40635-020-00312-4. Intensive Care Med Exp. 2020. PMID: 32676795 Free PMC article.
References
- Angus DC, Wax RS. Epidemiology of sepsis: an update. Crit Care Med 2001;29:S109–S116. - PubMed
- Abraham E, Singer M. Mechanisms of sepsis-induced organ dysfunction. Crit Care Med 2007;35:2408–2416. - PubMed
- Hotchkiss RS, Karl IE. The pathophysiology and treatment of sepsis. N Engl J Med 2003;348:138–150. - PubMed
- Leverve XM. Mitochondrial function and substrate availability. Crit Care Med 2007;35:S454–S460. - PubMed
Publication types
MeSH terms
Substances
LinkOut - more resources
Full Text Sources
Other Literature Sources


