Multivariate Cutoff Level Analysis (MultiCoLA) of large community data sets - PubMed (original) (raw)
Multivariate Cutoff Level Analysis (MultiCoLA) of large community data sets
Angélique Gobet et al. Nucleic Acids Res. 2010 Aug.
Abstract
High-throughput sequencing techniques are becoming attractive to molecular biologists and ecologists as they provide a time- and cost-effective way to explore diversity patterns in environmental samples at an unprecedented resolution. An issue common to many studies is the definition of what fractions of a data set should be considered as rare or dominant. Yet this question has neither been satisfactorily addressed, nor is the impact of such definition on data set structure and interpretation been fully evaluated. Here we propose a strategy, MultiCoLA (Multivariate Cutoff Level Analysis), to systematically assess the impact of various abundance or rarity cutoff levels on the resulting data set structure and on the consistency of the further ecological interpretation. We applied MultiCoLA to a 454 massively parallel tag sequencing data set of V6 ribosomal sequences from marine microbes in temperate coastal sands. Consistent ecological patterns were maintained after removing up to 35-40% rare sequences and similar patterns of beta diversity were observed after denoising the data set by using a preclustering algorithm of 454 flowgrams. This example validates the importance of exploring the impact of the definition of rarity in large community data sets. Future applications can be foreseen for data sets from different types of habitats, e.g. other marine environments, soil and human microbiota.
Figures
Figure 1.
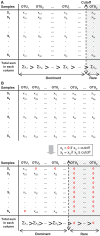
Two ways of assigning rarity cutoffs to the original data set. (A) In the data set-based approach, cutoff levels are assigned to the original data set according to several percentages (0, 1, 5–95 and 99%) of the total number of sequences in the data set. The data set was sorted according to the decreasing total sum of OTU sequences (columns, here) before selecting out rare OTUs. For instance, a cutoff assignment of 1% removes 1% of the low-abundant OTUs. (B) In the sample-based approach, cutoff levels are assigned to the original data set according to the occurrence (1–208 sequences) of each OTU in each sample. The maximum cutoff (here, 208) was chosen according to the lowest number of the maximum OTU occurrences in all samples; this is the limit when some samples did not contain any more OTUs. For example, the assignment of a cutoff level of 3 removes OTUs occurring less than three times in each sample.
Figure 2.
MultiCoLA steps. After truncating the original table according to various abundance cutoff levels, the effects of specific rarity definitions are tested by applying three types of analyses: (1) Variations in data set structure are established based on non-parametric correlations of pairwise distance matrices (e.g. calculated with the Bray–Curtis coefficient). (2) The amounts of extracted community variation (using NMDS) from the original data and the truncated data sets are compared by Procrustes correlations. (3) When additional parameters are available, the biological variation that can be explained by environmental parameters in the original and in the truncated data sets are then systematically compared. D, dominant OTUs; R, rare OTUs.
Figure 3.
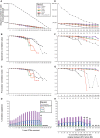
MultiCoLA profiles for data set structure, most important axes of extracted variation and interpretation of biological variation based on the data set-based (A–D) and sample-based (E–H) approaches. (A, E) Abundance of dominant OTUs in each truncated data set at the phylum, class, order, family, genus and OTU levels. A black solid line indicates comparisons at the OTU level for the data set with a complete annotation and a black dashed line indicates the OTU level with the whole data set (OTU whole DS). (B, F) Non-parametric Spearman correlations comparing the deviation in complete data structure between the original matrix and truncated matrices. (C, G) Comparison of most important axes of extracted variation between the original and truncated data sets. (D, H) Partitioning of the biological variation at the OTU level (all OTUs) into the respective effects of environmental factors (nutrients and cell abundance). Negative values, unexplained variation and non-significant models are not shown. SiO2, silicate; PO4, phosphate; NH4, ammonium; covariation of any of the four environmental factors is represented under the same category. Asterisk indicates a significant effect of the pure factors (P < 5%), whereas ‘NS’ indicates non-significant models. A cross indicates non-significant Bonferroni corrected models. Lacking points or bars are due to sample loss by applying a given cutoff to the original data set. In (E–H), the upper _x_-axis corresponds to cutoff levels defined as a function of the sample-based approach, and the lower _x_-axis represents the corresponding proportion of removed sequences in the OTU data set (all OTUs). This enables the comparison of the data set-based approach with the sample-based approach. Note that (D and H) have a different legend than (A–C) and (E–G).
Figure 4.
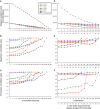
MultiCoLA profiles for data set structure and most important axes of extracted variation based on the data set (A–C) and sample (D–F) cutoff approaches for PyroNoise-corrected 454 MPTS data and the original 454 MPTS data set at the OTU level. Different colored lines indicate PyroNoise-corrected data sets whose sequences were further clustered at various sequence dissimilarity values. See Figure 3 for further details.
Figure 5.
MultiCoLA profiles using the matrix with the most abundant OTUs as a reference for the comparison with the truncated matrices. (A–C) are based on the data set-based approach and (D–F) on the sample-based approach. See Figure 3 for further descriptions of each panel.
Similar articles
- Ecological coherence of diversity patterns derived from classical fingerprinting and Next Generation Sequencing techniques.
Gobet A, Boetius A, Ramette A. Gobet A, et al. Environ Microbiol. 2014 Sep;16(9):2672-81. doi: 10.1111/1462-2920.12308. Epub 2013 Nov 14. Environ Microbiol. 2014. PMID: 24147993 Free PMC article. - Regional Similarities and Consistent Patterns of Local Variation in Beach Sand Bacterial Communities throughout the Northern Hemisphere.
Staley C, Sadowsky MJ. Staley C, et al. Appl Environ Microbiol. 2016 Apr 18;82(9):2751-2762. doi: 10.1128/AEM.00247-16. Print 2016 May. Appl Environ Microbiol. 2016. PMID: 26921429 Free PMC article. - Broadscale Ecological Patterns Are Robust to Use of Exact Sequence Variants versus Operational Taxonomic Units.
Glassman SI, Martiny JBH. Glassman SI, et al. mSphere. 2018 Jul 18;3(4):e00148-18. doi: 10.1128/mSphere.00148-18. mSphere. 2018. PMID: 30021874 Free PMC article. - Massively parallel tag sequencing reveals the complexity of anaerobic marine protistan communities.
Stoeck T, Behnke A, Christen R, Amaral-Zettler L, Rodriguez-Mora MJ, Chistoserdov A, Orsi W, Edgcomb VP. Stoeck T, et al. BMC Biol. 2009 Nov 3;7:72. doi: 10.1186/1741-7007-7-72. BMC Biol. 2009. PMID: 19886985 Free PMC article. - Deciphering Diversity Indices for a Better Understanding of Microbial Communities.
Kim BR, Shin J, Guevarra R, Lee JH, Kim DW, Seol KH, Lee JH, Kim HB, Isaacson R. Kim BR, et al. J Microbiol Biotechnol. 2017 Dec 28;27(12):2089-2093. doi: 10.4014/jmb.1709.09027. J Microbiol Biotechnol. 2017. PMID: 29032640 Review.
Cited by
- Absolute quantification of microbial taxon abundances.
Props R, Kerckhof FM, Rubbens P, De Vrieze J, Hernandez Sanabria E, Waegeman W, Monsieurs P, Hammes F, Boon N. Props R, et al. ISME J. 2017 Feb;11(2):584-587. doi: 10.1038/ismej.2016.117. Epub 2016 Sep 9. ISME J. 2017. PMID: 27612291 Free PMC article. - Differential roles of deterministic and stochastic processes in structuring soil bacterial ecotypes across terrestrial ecosystems.
Riddley M, Hepp S, Hardeep F, Nayak A, Liu M, Xing X, Zhang H, Liao J. Riddley M, et al. Nat Commun. 2025 Mar 8;16(1):2337. doi: 10.1038/s41467-025-57526-x. Nat Commun. 2025. PMID: 40057505 Free PMC article. - Bacterial taxa-area and distance-decay relationships in marine environments.
Zinger L, Boetius A, Ramette A. Zinger L, et al. Mol Ecol. 2014 Feb;23(4):954-64. doi: 10.1111/mec.12640. Epub 2014 Jan 25. Mol Ecol. 2014. PMID: 24460915 Free PMC article. - Rare Bacteria Assembly in Soils Is Mainly Driven by Deterministic Processes.
Xu Q, Ling N, Quaiser A, Guo J, Ruan J, Guo S, Shen Q, Vandenkoornhuyse P. Xu Q, et al. Microb Ecol. 2022 Jan;83(1):137-150. doi: 10.1007/s00248-021-01741-8. Epub 2021 Apr 1. Microb Ecol. 2022. PMID: 33792742 - Global patterns of bacterial beta-diversity in seafloor and seawater ecosystems.
Zinger L, Amaral-Zettler LA, Fuhrman JA, Horner-Devine MC, Huse SM, Welch DB, Martiny JB, Sogin M, Boetius A, Ramette A. Zinger L, et al. PLoS One. 2011;6(9):e24570. doi: 10.1371/journal.pone.0024570. Epub 2011 Sep 8. PLoS One. 2011. PMID: 21931760 Free PMC article.
References
- Gauch HG. Multivariate Analyses in Community Ecology. Cambridge: Cambridge University Press; 1982.
- Prendergast JR, Quinn RM, Lawton JH, Eversham BC, Gibbons DW. Rare species, the coincidence of diversity hotspots and conservation strategies. Nature. 1993;365:335–337.
- Magurran AE, Henderson PA. Explaining the excess of rare species in natural species abundance distributions. Nature. 2003;422:714–716. - PubMed
- Pedrós-Alió C. Marine microbial diversity: can it be determined? Trends Microbiol. 2006;14:257–263. - PubMed


