Nitric oxide and AMPK cooperatively regulate PGC-1 in skeletal muscle cells - PubMed (original) (raw)
Nitric oxide and AMPK cooperatively regulate PGC-1 in skeletal muscle cells
Vitor A Lira et al. J Physiol. 2010.
Abstract
Nitric oxide (NO) induces mitochondrial biogenesis in skeletal muscle cells via upregulation of the peroxisome proliferator-activated receptor-γ coactivator 1α (PGC-1α). Further, we have shown that nitric oxide interacts with the metabolic sensor enzyme, AMPK. Therefore, we tested the hypothesis that nitric oxide and AMPK act synergistically to upregulate PGC-1α mRNA expression and stimulate mitochondrial biogenesis in culture. L6 myotubes treated with nitric oxide donors, S-nitroso-N-penicillamine (SNAP, 25 μM) or diethylenetriamine-NONO (DETA-NO, 50 μM), exhibited elevated AMPK phosphorylation, PGC-1α mRNA and protein, and basal and uncoupled mitochondrial respiration (P < 0.05). Pre-treatment of cultures with the AMPK inhibitor, Compound C, prevented these effects. Knockdown of AMPKα1 in L6 myotubes using siRNA reduced AMPKα protein content and prevented upregulation of PGC-1α mRNA by DETA-NO. Meanwhile, siRNA knockdown of AMPKα2 had no effect on total AMPKα protein content or PGC-1α mRNA. These results suggest that NO effects on PGC-1α expression are mediated by AMPKα1. Paradoxically, we found that the AMPK-activating compound, AICAR, induced NO release from L6 myotubes, and that AICAR-induced upregulation of PGC-1α mRNA was prevented by inhibition of NOS with N(G)-nitro-L-arginine methyl ester (L-NAME, 1 mM). Additionally, incubation of isolated mouse extensor digitorum longus (EDL) muscles with 2 mM AICAR for 20 min or electrical stimulation (10 Hz, 13 V) for 10 min induced phosphorylation of AMPKα (P < 0.05), which was completely prevented by pre-treatment with the NOS inhibitor, L-N(G)-monomethyl arginine (L-NMMA, 1 mM). These data identify the AMPKα1 isoform as the mediator of NO-induced effects in skeletal muscle cells. Further, this study supports a proposed model of synergistic interaction between AMPK and NOS that is critical for maintenance of metabolic function in skeletal muscle cells.
Figures
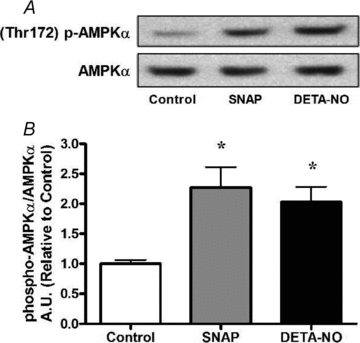
Figure 1. NO donors SNAP (25 μm) and DETA-NO (50 μm) increase AMPKα phosphorylation in myotubes
L6 cells were treated for 1 h and immediately harvested. A, representative immunoblots. B, quantification of immunoblots for AMPKα phosphorylation normalized to total AMPKα expression (n = 4/group). *P < 0.05 in comparison to untreated cells (Control).
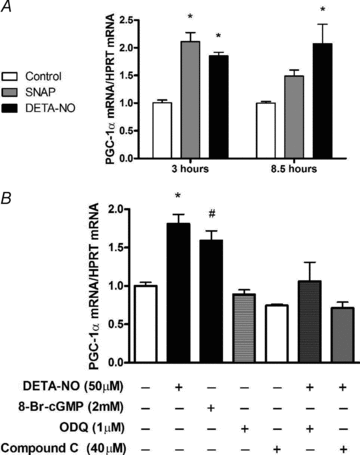
Figure 2. NO donors SNAP (25 μm) and DETA-NO (50 μm) induce PGC-1α mRNA expression in myotubes which is prevented by pharmacological inhibition of sGC and AMPK
A, L6 cells were treated for 3 h and 8.5 h and immediately harvested. Values represent fold changes (means ±
s.e.m.
) versus untreated cells (Control) at the same time point (n = 4–6/group). *P < 0.05 in comparison to Control. B, L6 cells were exposed to inhibitors 1 h prior and during the 3 h treatments with DETA-NO. Cells were harvested immediately after treaments. Values represent fold changes (means ±
s.e.m.
) versus untreated (Control) cells (n = 4–5/group). *P < 0.05 in comparison to all groups except 8-Br-cGMP, #P < 0.05 in comparison to all groups except DETA-NO and ODQ+DETA-NO.
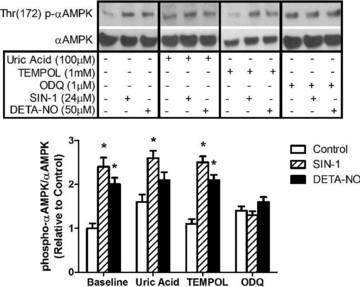
Figure 3. AMPKα phosphorylation induced by NO donors (24 μm SIN-1 and 50 μm DETA-NO) in myotubes is prevented by pharmacological inhibition of sGC
L6 myotubes were treated for 1 h with DETA-NO or the peroxynitrite generating compound, SIN-1, in the presence of uric acid to scavenge peroxynitrite, TEMPOL to scavenge superoxide, or ODQ to inhibit soluble guanylate cyclase (sGC) (n = 5–6/group). *P < 0.05 in comparison to untreated cells (Control).
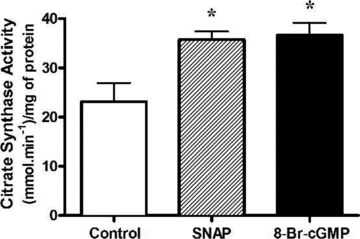
Figure 4. Chronic NO and cGMP treatments increase maximal citrate synthase activity in myotubes
L6 cells were treated for 48 h with either SNAP (25 μ
m
) or 8-Br-cGMP (2 m
m
) and were immediately harvested. Values represent enzyme activity normalized to protein concentration (means ±
s.e.m.
, n = 6/group). *P < 0.05 compared to Control.
Figure 5. AMPK inhibition prevents chronic NO-dependent upregulation of PGC-1α protein and basal and maximal mitochondrial respiration in myotubes
L6 cells were treated for 4 days (PGC-1α protein) or 5 days (mitochondrial respiration), 12 h day−1 with DETA-NO (50 μ
m
) and Compound C (10 μ
m
) and harvested 10 h after the last treatment (refer to Methods for details). A, representative immunoblots for PGC-1α protein. B, quantification of immunoblots for PGC-1α protein expression. C, quantification of mitochondrial respiration rates normalized to protein concentration in L6 myotubes (means ±
s.e.m.
, n = 5/group). *P < 0.05 in comparison to all groups (except for Compound C in mitochondrial respiration), #P < 0.05 in comparison to DETA-NO + Compound C (P = 0.054 in comparison to Control).
Figure 6. Knockdown of AMPKα1 prevents NO-dependent increase in PGC-1α mRNA
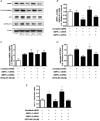
L6 cells were exposed to DETA-NO treatments after 48 h of transfection (n = 6–9/group, refer to Methods for details). Protein expression was assessed after treatments of 1 h. mRNA expression was analysed in cells treated for 3 h. A, representative immunoblots of proteins assessed and their phosphorylation status. B, AMPKα expression (*P < 0.05 in comparison to Control, Unrelated siRNA and AMPKα2 siRNA, P = 0.09 between Control and AMPKα1 siRNA +AMPKα2 siRNA groups). C, phospho-to-total AMPKα ratio. D, phospho-to-total ACC ratio (*P < 0.05 in comparison to Control and AMPKα1, P = 0.07 between either Unrelated siRNA or AMPKα2 siRNA and AMPKα1 siRNA +AMPKα2 siRNA groups). E, PGC-1α mRNA (*P < 0.05 in comparison to Control, AMPKα1 siRNA and AMPKα1 siRNA +AMPKα2 siRNA groups).
Figure 7. NO-dependent activation of the 2 kb PGC-1α promoter in myotubes
A, representative immunoblots of non-transfected C2C12 cells treated for 1 h with DETA-NO (50 μ
m
). B, quantification of immunoblots for AMPKα phosphorylation normalized to total AMPKα expression (n = 4/group). C, PGC-1α mRNA induction in non-transfected C2C12 cells treated with DETA-NO (50 μ
m
) for 3 h (n = 4–6/group). D, activity of the intact 2 kb PGC-1α promoter and mutated promoters in C2C12 cells treated 48 h after transfection with DETA-NO (50 μ
m
) for 9 h (n = 12–15/group in pGL3 control & PGC-1α experiments; n = 8–12 in ΔCRE and ΔMEF2 experiments). Values represent fold changes (means ±
s.e.m.
) versus untreated (control) cells (refer to Methods for details). *P < 0.05 compared to Control.
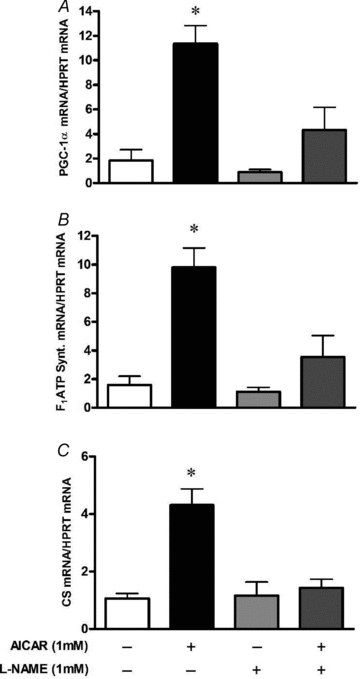
Figure 8. NOS inhibition blunts AMPK-dependent upregulation of mitochondrial biogenesis markers in myotubes
L6 cells were exposed to
l
-NAME 1 h prior and during the AICAR treatments of 16 h. Cells were harvested immediately after treatments. Values represent fold change versus untreated (Control) cells (means ±
s.e.m.
, n = 5–7/group). Effect of AICAR treatment alone or in combination with
l
-NAME in PGC-1α mRNA (A), F1ATP synthase mRNA (B) and citrate synthase mRNA (C). *P < 0.05 in comparison to all other groups.
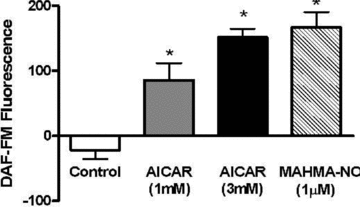
Figure 9. AMPK activation stimulates NO production in myotubes
L6 cells were pre-loaded with DAF-FM, after which background fluorescence was assessed. Final fluorescence was determined following treatments of 40 min with either AICAR or MAHMA-NO (refer to Methods for details). Values represent the fluorescence at 40 min of incubation minus the background fluorescence, and are presented as means ±
s.e.m.
of n = 6/group. *P < 0.05 compared to Control.
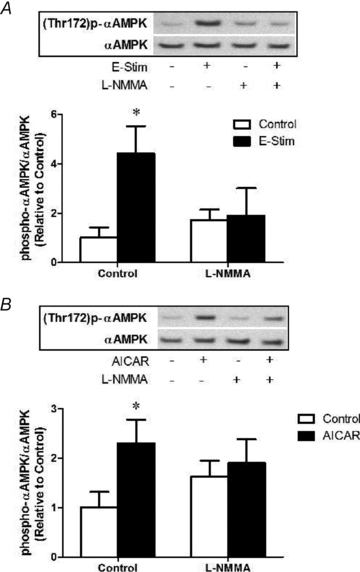
Figure 10. NOS inhibition prevents AMPKα phosphorylation induced by electrical stimulation or AICAR
A, muscles were exposed to
l
-NMMA 10 min prior and during stimulation at 10 Hz, 13 V for 10 min (refer to Methods for details). Quantification of immunoblots for AMPKα phosphorylation normalized to total AMPKα expression. Values represent means ±
s.e.m.
(n = 6–8/group). *P < 0.05 compared to Control. B, muscles were exposed to
l
-NMMA 10 min prior to and during subsequent treatment with AICAR (2 m
m
) for 20 min (refer to Methods for details). Quantification of immunoblots for AMPKα phosphorylation normalized to total AMPKα expression. Values represent means ±
s.e.m.
(n = 6–8/group). *P < 0.05 compared to Control.
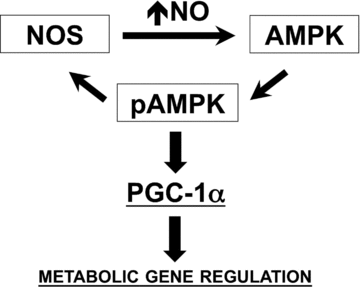
Figure 11. Proposed model for NO and AMPK interaction that impacts PGC-1α expression and metabolic phenotype in skeletal muscle
Our cumulative observations provide evidence for a positive feedback loop between NO production and AMPK activation that impacts the expression of PGC-1α, mitochondrial genes and GLUT4. Although both AMPK and NOS enzymes can be regulated by multiple mechanisms, our data with NOS inhibitors suggest that basal NOS activity and basal intracellular NO levels are required for AMPK to respond to AICAR and electrical stimulation in skeletal muscle. The observation of NOS inhibitors also preventing AICAR-mediated upregulation of PGC-1α, mitochondrial genes and GLUT4 in skeletal muscle myotubes supports this notion as well. The mechanisms for such regulation remain to be determined, but possibly involve regulation of AMPK kinases and/or AMPK phosphatases. Our current results further demonstrate that small elevations in intracellular NO levels upregulate PGC-1α and other metabolic genes (e.g. GLUT4) in a process that requires functional AMPKα1. Differently from the exercise-mediated induction of PGC-1α, NO-dependent regulation does not require the MEF2 and CRE cis elements at the 2 kb proximal promoter of PGC-1α (refer to text for details).
Similar articles
- Central role of nitric oxide synthase in AICAR and caffeine-induced mitochondrial biogenesis in L6 myocytes.
McConell GK, Ng GP, Phillips M, Ruan Z, Macaulay SL, Wadley GD. McConell GK, et al. J Appl Physiol (1985). 2010 Mar;108(3):589-95. doi: 10.1152/japplphysiol.00377.2009. Epub 2009 Dec 31. J Appl Physiol (1985). 2010. PMID: 20044477 - Role of the α2 subunit of AMP-activated protein kinase and its nuclear localization in mitochondria and energy metabolism-related gene expressions in C2C12 cells.
Okamoto S, Asgar NF, Yokota S, Saito K, Minokoshi Y. Okamoto S, et al. Metabolism. 2019 Jan;90:52-68. doi: 10.1016/j.metabol.2018.10.003. Epub 2018 Oct 23. Metabolism. 2019. PMID: 30359677 - Interactions between ROS and AMP kinase activity in the regulation of PGC-1alpha transcription in skeletal muscle cells.
Irrcher I, Ljubicic V, Hood DA. Irrcher I, et al. Am J Physiol Cell Physiol. 2009 Jan;296(1):C116-23. doi: 10.1152/ajpcell.00267.2007. Epub 2008 Nov 12. Am J Physiol Cell Physiol. 2009. PMID: 19005163 - Impact of fasting on the AMPK and PGC-1α axis in rodent and human skeletal muscle: A systematic review.
Storoschuk KL, Lesiuk D, Nuttall J, LeBouedec M, Khansari A, Islam H, Gurd BJ. Storoschuk KL, et al. Metabolism. 2024 Mar;152:155768. doi: 10.1016/j.metabol.2023.155768. Epub 2023 Dec 27. Metabolism. 2024. PMID: 38154612 - Metabolic control of mitochondrial biogenesis through the PGC-1 family regulatory network.
Scarpulla RC. Scarpulla RC. Biochim Biophys Acta. 2011 Jul;1813(7):1269-78. doi: 10.1016/j.bbamcr.2010.09.019. Epub 2010 Oct 13. Biochim Biophys Acta. 2011. PMID: 20933024 Free PMC article. Review.
Cited by
- Nuclear factor erythroid-derived 2-like 2 (NFE2L2, Nrf2) mediates exercise-induced mitochondrial biogenesis and the anti-oxidant response in mice.
Merry TL, Ristow M. Merry TL, et al. J Physiol. 2016 Sep 15;594(18):5195-207. doi: 10.1113/JP271957. Epub 2016 May 27. J Physiol. 2016. PMID: 27094017 Free PMC article. - IRE1-dependent activation of AMPK in response to nitric oxide.
Meares GP, Hughes KJ, Naatz A, Papa FR, Urano F, Hansen PA, Benveniste EN, Corbett JA. Meares GP, et al. Mol Cell Biol. 2011 Nov;31(21):4286-97. doi: 10.1128/MCB.05668-11. Epub 2011 Sep 6. Mol Cell Biol. 2011. PMID: 21896783 Free PMC article. - Relation of nNOS isoforms to mitochondrial density and PGC-1alpha expression in striated muscles of mice.
Baum O, Aaldijk D, Engeli AL, Spree M, Summermatter S, Handschin C, Zakrzewicz A. Baum O, et al. Nitric Oxide. 2018 Jul 1;77:35-43. doi: 10.1016/j.niox.2018.04.005. Epub 2018 Apr 17. Nitric Oxide. 2018. PMID: 29678764 Free PMC article. - From Slow to Fast: Hypogravity-Induced Remodeling of Muscle Fiber Myosin Phenotype.
Shenkman BS. Shenkman BS. Acta Naturae. 2016 Oct-Dec;8(4):47-59. Acta Naturae. 2016. PMID: 28050266 Free PMC article. - DNA damage related crosstalk between the nucleus and mitochondria.
Saki M, Prakash A. Saki M, et al. Free Radic Biol Med. 2017 Jun;107:216-227. doi: 10.1016/j.freeradbiomed.2016.11.050. Epub 2016 Nov 30. Free Radic Biol Med. 2017. PMID: 27915046 Free PMC article. Review.
References
- Akimoto T, Sorg BS, Yan Z. Real-time imaging of peroxisome proliferator-activated receptor-γ coactivator-1α promoter activity in skeletal muscles of living mice. Am J Physiol Cell Physiol. 2004;287:C790–C796. - PubMed
- Balon TW, Jasman AP. Acute exposure to AICAR increases glucose transport in mouse EDL and soleus muscle. Biochem Biophys Res Commun. 2001;282:1008–1011. - PubMed
- Bonen A, Clark MG, Henriksen EJ. Experimental approaches in muscle metabolism: hindlimb perfusion and isolated muscle incubations. Am J Physiol Endocrinol Metab. 1994;266:E1–E16. - PubMed
- Bonnard C, Durand A, Vidal H, Rieusset J. Changes in adiponectin, its receptors and AMPK activity in tissues of diet-induced diabetic mice. Diabetes Metab. 2008;34:52–61. - PubMed
- Borniquel S, Valle I, Cadenas S, Lamas S, Monsalve M. Nitric oxide regulates mitochondrial oxidative stress via the transcriptional coactivator PGC1α. FASEB J. 2006;20:1889–1891. - PubMed
Publication types
MeSH terms
Substances
LinkOut - more resources
Full Text Sources
Other Literature Sources
Research Materials
