Inference of homologous recombination in bacteria using whole-genome sequences - PubMed (original) (raw)
Inference of homologous recombination in bacteria using whole-genome sequences
Xavier Didelot et al. Genetics. 2010 Dec.
Abstract
Bacteria and archaea reproduce clonally, but sporadically import DNA into their chromosomes from other organisms. In many of these events, the imported DNA replaces an homologous segment in the recipient genome. Here we present a new method to reconstruct the history of recombination events that affected a given sample of bacterial genomes. We introduce a mathematical model that represents both the donor and the recipient of each DNA import as an ancestor of the genomes in the sample. The model represents a simplification of the previously described coalescent with gene conversion. We implement a Monte Carlo Markov chain algorithm to perform inference under this model from sequence data alignments and show that inference is feasible for whole-genome alignments through parallelization. Using simulated data, we demonstrate accurate and reliable identification of individual recombination events and global recombination rate parameters. We applied our approach to an alignment of 13 whole genomes from the Bacillus cereus group. We find, as expected from laboratory experiments, that the recombination rate is higher between closely related organisms and also that the genome contains several broad regions of elevated levels of recombination. Application of the method to the genomic data sets that are becoming available should reveal the evolutionary history and private lives of populations of bacteria and archaea. The methods described in this article have been implemented in a computer software package, ClonalOrigin, which is freely available from http://code.google.com/p/clonalorigin/.
Figures
Figure 1.—
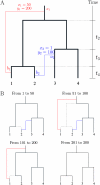
Illustration of our model for a single region of 300 bp and a sample of four isolates. (A) The full graph of ancestry, with the clonal genealogy shown in thick black lines and two recombination events shown in red and blue. The red event, for example, affected the positions 50–200 of an ancestor of the first isolate at the point _b_1, and the donor last shared clonal ancestry with the sample at the point _a_1. (B) The local trees for each site. Points ai are denoted as “departures” of recombinant edges from the tree and bi are “arrivals,” with bi occurring closer to the observed sequences at the tips.
Figure 2.—
Results on simulated data for a single simulation. The clonal genealogy is shown on the left, and each node is given a color. Each horizontal row on the right represents the arrival of recombination on the branch of the clonal genealogy it is aligned with. For each row, the _x_-axis represents the sequence measured in base pairs and the _y_-axis represents the probability of recombination on a scale from 0 (where the magenta line is most of the time) to 1 (just below the light gray line). ClonalFrame inference is represented by a thin magenta line. ClonalOrigin inference is shown in solid colors according to their reconstructed origin. Small bars above each row correspond to the true recombined regions in the ARG and are colored according to their origin (or in very light gray to represent absence of recombination). For example, on the branch above genome 9, two real events have occurred, both from an “orange” origin. The first one (around position 900) was fairly short and therefore stayed undetected. The second one (around position 5200) was detected by ClonalFrame with posterior probability close to 100% and by ClonalOrigin with posterior probability ∼50% and an origin very likely to be orange but that could also be brown or red.
Figure 3.—
Inferred values of ρ relative to true values for many simulated data sets across various parameter values. Shown are values for ClonalFrame (magenta) and ClonalOrigin (blue). For each of the six values of θ we plot the median (thick line) and interquartile range (thin line) of the ratio of inferred ρ/true ρ, considering the combined results for 10 different instances of the ARG. Lines are labeled by the order they appear at ρ = 400. The true value of 1 is shown as a horizontal line for comparison.
Figure 4.—
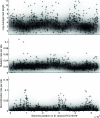
Scatterplots for all blocks of the stage 2 analysis of Bacillus, showing the inferred values of the log-average tract length (log(δ)), the mutation rate per site (θs/2), and recombination rate per site (ρs/2). A density plot of the scatterplot is shown using gray shading. The median for all blocks is shown in red.
Figure 5.—
Heat map for the Bacillus stage 3 analysis showing the number of recombination events inferred relative to its expectation under our prior model given the stage 2 inferred recombination rate, for each donor/recipient pair of branches. The cells in very light gray are the ones for which the ratio would be meaningless because there are less than three observed and expected events.
Figure 6.—
Scatterplot of the stage 2 analysis of Bacillus showing the number of recombination event boundaries per site for each block in the alignment of Bacillus. Details of the two blocks shown by a blue and a green dot are shown in Figure 7.
Figure 7.—
Results of our stage 3 analysis for two example regions of the Bacillus alignment. The representation is the same as in Figure 2. The two regions are shown by a blue and a green dot, respectively, in Figure 6.
Similar articles
- ClonalFrameML: efficient inference of recombination in whole bacterial genomes.
Didelot X, Wilson DJ. Didelot X, et al. PLoS Comput Biol. 2015 Feb 12;11(2):e1004041. doi: 10.1371/journal.pcbi.1004041. eCollection 2015 Feb. PLoS Comput Biol. 2015. PMID: 25675341 Free PMC article. - Inference of the properties of the recombination process from whole bacterial genomes.
Ansari MA, Didelot X. Ansari MA, et al. Genetics. 2014 Jan;196(1):253-65. doi: 10.1534/genetics.113.157172. Epub 2013 Oct 30. Genetics. 2014. PMID: 24172133 Free PMC article. - The Bacterial Sequential Markov Coalescent.
De Maio N, Wilson DJ. De Maio N, et al. Genetics. 2017 May;206(1):333-343. doi: 10.1534/genetics.116.198796. Epub 2017 Mar 3. Genetics. 2017. PMID: 28258183 Free PMC article. - Genomics of the Bacillus cereus group of organisms.
Rasko DA, Altherr MR, Han CS, Ravel J. Rasko DA, et al. FEMS Microbiol Rev. 2005 Apr;29(2):303-29. doi: 10.1016/j.femsre.2004.12.005. FEMS Microbiol Rev. 2005. PMID: 15808746 Review. - Unraveling recombination rate evolution using ancestral recombination maps.
Munch K, Schierup MH, Mailund T. Munch K, et al. Bioessays. 2014 Sep;36(9):892-900. doi: 10.1002/bies.201400047. Epub 2014 Jul 14. Bioessays. 2014. PMID: 25043668 Free PMC article. Review.
Cited by
- Horizontal transmission and recombination maintain forever young bacterial symbiont genomes.
Russell SL, Pepper-Tunick E, Svedberg J, Byrne A, Ruelas Castillo J, Vollmers C, Beinart RA, Corbett-Detig R. Russell SL, et al. PLoS Genet. 2020 Aug 25;16(8):e1008935. doi: 10.1371/journal.pgen.1008935. eCollection 2020 Aug. PLoS Genet. 2020. PMID: 32841233 Free PMC article. - After the bottleneck: Genome-wide diversification of the Mycobacterium tuberculosis complex by mutation, recombination, and natural selection.
Namouchi A, Didelot X, Schöck U, Gicquel B, Rocha EP. Namouchi A, et al. Genome Res. 2012 Apr;22(4):721-34. doi: 10.1101/gr.129544.111. Epub 2012 Feb 29. Genome Res. 2012. PMID: 22377718 Free PMC article. - ClonalFrameML: efficient inference of recombination in whole bacterial genomes.
Didelot X, Wilson DJ. Didelot X, et al. PLoS Comput Biol. 2015 Feb 12;11(2):e1004041. doi: 10.1371/journal.pcbi.1004041. eCollection 2015 Feb. PLoS Comput Biol. 2015. PMID: 25675341 Free PMC article. - Recombination-mediated dissemination of Methicillin-resistant S. aureus clonal complex 1 in the Egyptian health care settings.
Elsayed SW, Elghaish RA, Badr E, Mouftah SF, Saif NA, Naga IS, Shata AH, Pascoe B, Sheppard SK, Elhadidy M. Elsayed SW, et al. Ann Clin Microbiol Antimicrob. 2023 Dec 14;22(1):109. doi: 10.1186/s12941-023-00659-y. Ann Clin Microbiol Antimicrob. 2023. PMID: 38098126 Free PMC article. - Genomic evolution and transmission of Helicobacter pylori in two South African families.
Didelot X, Nell S, Yang I, Woltemate S, van der Merwe S, Suerbaum S. Didelot X, et al. Proc Natl Acad Sci U S A. 2013 Aug 20;110(34):13880-5. doi: 10.1073/pnas.1304681110. Epub 2013 Jul 29. Proc Natl Acad Sci U S A. 2013. PMID: 23898187 Free PMC article.
References
- Achtman, M., T. Azuma, D. E. Berg, Y. Ito, G. Morelli et al., 1999. Recombination and clonal groupings within Helicobacter pylori from different geographical regions. Mol. Microbiol. 32 459–470. - PubMed
- Canchaya, C., G. Fournous, S. Chibani-Chennoufi, M. L. Dillmann and H. Brüssow, 2003. Phage as agents of lateral gene transfer. Curr. Opin. Microbiol. 6 417–424. - PubMed
- Claverys, J. P., B. Martin and P. Polard, 2009. The genetic transformation machinery: composition, localization, and mechanism. FEMS Microbiol. Rev. 33 643–656. - PubMed
Publication types
MeSH terms
LinkOut - more resources
Full Text Sources
Other Literature Sources


