Control of transcription by cell size - PubMed (original) (raw)
Control of transcription by cell size
Chia-Yung Wu et al. PLoS Biol. 2010.
Abstract
Cell size increases significantly with increasing ploidy. Differences in cell size and ploidy are associated with alterations in gene expression, although no direct connection has been made between cell size and transcription. Here we show that ploidy-associated changes in gene expression reflect transcriptional adjustment to a larger cell size, implicating cellular geometry as a key parameter in gene regulation. Using RNA-seq, we identified genes whose expression was altered in a tetraploid as compared with the isogenic haploid. A significant fraction of these genes encode cell surface proteins, suggesting an effect of the enlarged cell size on the differential regulation of these genes. To test this hypothesis, we examined expression of these genes in haploid mutants that also produce enlarged size. Surprisingly, many genes differentially regulated in the tetraploid are identically regulated in the enlarged haploids, and the magnitude of change in gene expression correlates with the degree of size enlargement. These results indicate a causal relationship between cell size and transcription, with a size-sensing mechanism that alters transcription in response to size. The genes responding to cell size are enriched for those regulated by two mitogen-activated protein kinase pathways, and components in those pathways were found to mediate size-dependent gene regulation. Transcriptional adjustment to enlarged cell size could underlie other cellular changes associated with polyploidy. The causal relationship between cell size and transcription suggests that cell size homeostasis serves a regulatory role in transcriptome maintenance.
Conflict of interest statement
The authors have declared that no competing interests exist.
Figures
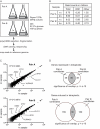
Figure 1. Identification of ploidy-regulated genes in yeast (Σ1278b).
(A) RNA-seq analysis of the Σ1278b haploid and tetraploid transcriptomes. Two pairs of haploid and tetraploid cultures, A and B, were processed for transcriptional profiling (using Illumina Genome Analyzer 2). Reads were mapped to the annotated Σ1278b genome. We calculated ORF expression based on the number of reads mapping inside the ORF. SC, synthetic complete medium. (B) RNA-seq read counts. More than 90% of the approximately 9 million reads in each sample were mapped to the genome. More than 60% of the mapped reads fell within annotated ORFs. The majority of remaining reads mapped to the rDNA locus and Ty elements. The processed data (with calculations for fold changes and p_-values) are in Dataset S1. (C) Ploidy alters expression of only a small number of genes. Read counts for all transcripts at the two ploidies are plotted, and several differentially regulated genes are specified. The comparable expression of most transcripts between the two ploidies shows that the tetraploid cells were euploid . (D) Identification of genes differentially expressed in the tetraploid. Within each pair of haploid (1_n)–tetraploid (4_n_) RNA-seq datasets, differentially expressed candidate genes were ranked by fold change in expression. Comparison of top-ranking candidates between both pairs produced overlapping genes that were called differentially expressed (see details in Materials and Methods). Cutoffs for top-ranking candidates were selected to obtain a sufficient set of overlapping genes for GO analysis while ensuring that the overlap remained highly statistically significant by hypergeomtric test.
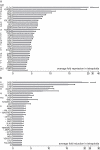
Figure 2. Genes differentially regulated in the Σ1278b tetraploid and their compartmental bias for encoding cell surface components.
Differentially expressed genes in the Σ1278b tetraploid are ranked by average fold change in expression from both pairs of RNA-seq data. Error bar indicates standard deviation. (A) Genes repressed in the tetraploid. (B) Genes induced in the tetraploid. Characterized genes are shown with their standard names in SGD. Notes on localization of the encoded protein according to SGD: E, extracellular space; P, plasma membrane; R, regulator of cell surface components with intracellular or unknown localization; W, cell wall. Asterisks indicate mitochondrial localization; this category is not statistically significant in our GO analysis but nevertheless represents a third of the induced genes. We did not find a bias for specific cell cycle stages among the differentially regulated genes (Table S1) .
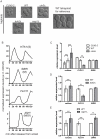
Figure 3. Enlarged cell size represses FLO11.
(A) Live cell images of WT and size mutant haploids. (B) FLO11 transcript abundance peaks in M-phase during the mitotic cycle. Upon release from alpha-factor arrest in G1, WT haploid cells were harvested at 10-min intervals. Cell cycle stages were assessed using expression profiles of known standard transcripts: HTA1 (S-phase), SWI5 (M-phase), and ASH1 (M/G1 transition) . The expression pattern of FLO11 resembles that of SWI5. It is worth noting that FLO11 was not found to be regulated by the cell cycle in a previous genome-wide study, because of a difference in yeast strain background (W303) ,. (C–E) Abundance of the FLO11 transcript inversely correlates with cell size in haploids. (C) _CLN3_-based size series (_MAT_alpha strains). (D) WT and _bck2_Δ MAT a strains. (E) WT and _eap1_Δ MAT a strains. Cln3 is the most upstream activator of G1/S transition and maintains the size threshold of mitotic START . Cln3 also regulates vacuolar morphology ,. Bck2 promotes G1/S transition independently of Cln3 . Eap1 regulates translation and has a separate role in chromosome segregation . Cell volume was measured from microscopy images. Gene expression was measured by qPCR. Expression of SWI5 was monitored to rule out the effect of cell cycle in data interpretation. Cell cycle arrest efficiency with nocodazole (>70%) was assessed by counting the percentage of cells arrested in metaphase (Table S6). Error bars indicate standard deviation. Statistical significance was calculated using Student's t test. *, p<0.05; **, p<0.01; ***, p<0.001. n = 50 for volume measurements. n = 3 for transcript quantification.
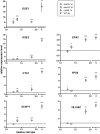
Figure 4. Differential regulation of the top-ranking size-repressed genes correlates with cell size.
Gene expression and cell size in each of the enlarged strains were compared to an isogenic WT haploid. The dashed line represents the expression level in the WT haploid, which was set to 1. Asterisks above each symbol denote the significance of difference in transcript level (*, p<0.05; **, p<0.01; ***, p<0.001; error bars indicate standard deviation; statistical significance was calculated using Student's t test with n = 3). To separate the effects of cell size from cell cycle, the comparison between WT and mutant haploids required cells treated with nocodazole, whereas the comparison between haploid and tetraploid required asynchronously grown cells (Table S7B). The expression levels of FLO11 and YLR042C in the _eap1_Δ mutant appeared significantly different from those in other size mutants. This mutation likely caused additional perturbations in the cell besides increasing cell size, and these perturbations may have specific effects on FLO11 and YLR042C.
Figure 5. Differential regulation of the top-ranking size-induced genes correlates with cell size.
See legend for Figure 4.
Figure 6. Differential down-regulation of the top-ranking size-repressed genes also occurs in the S288c strain background.
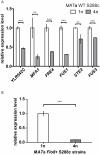
(A) Expression levels of the top-ranking size-repressed genes were examined in the WT MAT a haploids and tetraploids of the S288c strain background. MFA1, FUS1, STE2, and FUS3 are genes regulated by the mating MAPK pathway. The function of YLR042C is unknown, but the presence of Dig1 and Ste12 motifs in its promoter (Table S10) suggests that it could be regulated by the mating pathway. FRE4, not involved in the mating response, was included in the analysis because it is one of the most size-regulated genes in Σ1278b. FLO11 is not expressed in this background and thus was omitted. (B) Transcript levels of FLO11 in S288c strains expressing functional Flo8, a transcriptional activator required for FLO11 expression . All strains were cultured asynchronously in YPD until mid-log phase, and transcript abundance was measured by qPCR. Error bars indicate standard deviation. Statistical significance was calculated using Student's t test with n = 3. **, p<0.01; ***, p<0.001.
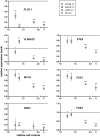
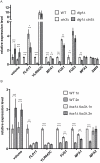
Figure 7. Cell size alters gene expression through the mating and the filamentation pathways.
(A) The transcriptional repressor Dig1 in the mating and the filamentation pathway is involved in gene repression by cell size. In the absence of Dig1, several size-repressed genes became less responsive to an increase in cell size. The fold changes in expression between the _dig1_Δ and the _dig1_Δ _cln3_Δ mutants were smaller than those between the WT and the _cln3_Δ mutant. All strains were haploid and MAT a in the Σ1278b background. As described in Figure 3, cells were cultured in the presence of nocodazole prior to subsequent processing, and SWI5 transcript was quantified to verify comparable cell cycle arrest. Error bars indicate standard deviation. Statistical significance was calculated using Student's t test; n = 50 for volume measurements; n = 3 for transcript quantification. *, p<0.05; **, p<0.01; ***, p<0.001. (B) The mating and the filamentation MAPKs (Fus3 and Kss1) contribute to differential regulation of downstream genes in large cells. In the _kss1_Δ _fus3_Δ double mutants, the effect of enlarged cell size on gene expression was reduced. The fold changes in expression between the mutant haploid and diploid strains were smaller than those between the WT haploid and diploid strains. Although all genes showed a reduction in fold change between the mutant haploids and diploids, expression levels of individual genes were affected differently by the double mutation. The unique response of each gene likely reflects gene-specific, additive effects of the single mutations. All strains were MAT a Σ1278b and were cultured asynchronously in YPD until mid-log phase. Statistical treatment was performed as in (A).
Comment in
- One size does not fit all for transcriptomes.
Burgess DJ. Burgess DJ. Nat Rev Genet. 2011 Jan;12(1):3. doi: 10.1038/nrg2922. Epub 2010 Nov 23. Nat Rev Genet. 2011. PMID: 21102528 No abstract available.
Similar articles
- Ploidy regulation of gene expression.
Galitski T, Saldanha AJ, Styles CA, Lander ES, Fink GR. Galitski T, et al. Science. 1999 Jul 9;285(5425):251-4. doi: 10.1126/science.285.5425.251. Science. 1999. PMID: 10398601 - Masking and purging mutations following EMS treatment in haploid, diploid and tetraploid yeast (Saccharomyces cerevisiae).
Mable BK, Otto SP. Mable BK, et al. Genet Res. 2001 Feb;77(1):9-26. doi: 10.1017/s0016672300004821. Genet Res. 2001. PMID: 11279834 - Perturbations of Transcription and Gene Expression-Associated Processes Alter Distribution of Cell Size Values in Saccharomyces cerevisiae.
Maitra N, Anandhakumar J, Blank HM, Kaplan CD, Polymenis M. Maitra N, et al. G3 (Bethesda). 2019 Jan 9;9(1):239-250. doi: 10.1534/g3.118.200854. G3 (Bethesda). 2019. PMID: 30463882 Free PMC article. - Transcriptional regulation by the proteasome as a mechanism for cellular protein homeostasis.
Auld KL, Silver PA. Auld KL, et al. Cell Cycle. 2006 Jul;5(14):1503-5. doi: 10.4161/cc.5.14.2979. Epub 2006 Jul 17. Cell Cycle. 2006. PMID: 16861887 Review. - Coordinating genome expression with cell size.
Marguerat S, Bähler J. Marguerat S, et al. Trends Genet. 2012 Nov;28(11):560-5. doi: 10.1016/j.tig.2012.07.003. Epub 2012 Aug 2. Trends Genet. 2012. PMID: 22863032 Review.
Cited by
- Control of cell proliferation, endoreduplication, cell size, and cell death by the retinoblastoma-related pathway in maize endosperm.
Sabelli PA, Liu Y, Dante RA, Lizarraga LE, Nguyen HN, Brown SW, Klingler JP, Yu J, LaBrant E, Layton TM, Feldman M, Larkins BA. Sabelli PA, et al. Proc Natl Acad Sci U S A. 2013 May 7;110(19):E1827-36. doi: 10.1073/pnas.1304903110. Epub 2013 Apr 22. Proc Natl Acad Sci U S A. 2013. PMID: 23610440 Free PMC article. - Organ size regulation in plants: insights from compensation.
Horiguchi G, Tsukaya H. Horiguchi G, et al. Front Plant Sci. 2011 Jul 1;2:24. doi: 10.3389/fpls.2011.00024. eCollection 2011. Front Plant Sci. 2011. PMID: 22639585 Free PMC article. - Transposable Elements versus the Fungal Genome: Impact on Whole-Genome Architecture and Transcriptional Profiles.
Castanera R, López-Varas L, Borgognone A, LaButti K, Lapidus A, Schmutz J, Grimwood J, Pérez G, Pisabarro AG, Grigoriev IV, Stajich JE, Ramírez L. Castanera R, et al. PLoS Genet. 2016 Jun 13;12(6):e1006108. doi: 10.1371/journal.pgen.1006108. eCollection 2016 Jun. PLoS Genet. 2016. PMID: 27294409 Free PMC article. - Adaptation to High Ethanol Reveals Complex Evolutionary Pathways.
Voordeckers K, Kominek J, Das A, Espinosa-Cantú A, De Maeyer D, Arslan A, Van Pee M, van der Zande E, Meert W, Yang Y, Zhu B, Marchal K, DeLuna A, Van Noort V, Jelier R, Verstrepen KJ. Voordeckers K, et al. PLoS Genet. 2015 Nov 6;11(11):e1005635. doi: 10.1371/journal.pgen.1005635. eCollection 2015 Nov. PLoS Genet. 2015. PMID: 26545090 Free PMC article. - Asymmetric genome merging leads to gene expression novelty through nucleo-cytoplasmic disruptions and transcriptomic shock in Chlamydomonas triploids.
Prost-Boxoen L, Bafort Q, Van de Vloet A, Almeida-Silva F, Paing YT, Casteleyn G, D'hondt S, De Clerck O, Van de Peer Y. Prost-Boxoen L, et al. New Phytol. 2025 Jan;245(2):869-884. doi: 10.1111/nph.20249. Epub 2024 Nov 5. New Phytol. 2025. PMID: 39501615
References
- Cook M, Tyers M. Size control goes global. Curr Opin Biotechnol. 2007;18:341–350. - PubMed
- Ganem N. J, Storchova Z, Pellman D. Tetraploidy, aneuploidy and cancer. Curr Opin Genet Dev. 2007;17:157–162. - PubMed
- Kasahara M. The 2R hypothesis: an update. Curr Opin Immunol. 2007;19:547–552. - PubMed
- Semon M, Wolfe K. H. Consequences of genome duplication. Curr Opin Genet Dev. 2007;17:505–512. - PubMed
Publication types
MeSH terms
LinkOut - more resources
Full Text Sources
Other Literature Sources
Molecular Biology Databases
