Strain-specific activation of the NF-kappaB pathway by GRA15, a novel Toxoplasma gondii dense granule protein - PubMed (original) (raw)
Strain-specific activation of the NF-kappaB pathway by GRA15, a novel Toxoplasma gondii dense granule protein
Emily E Rosowski et al. J Exp Med. 2011.
Abstract
NF-κB is an integral component of the immune response to Toxoplasma gondii. Although evidence exists that T. gondii can directly modulate the NF-κB pathway, the parasite-derived effectors involved are unknown. We determined that type II strains of T. gondii activate more NF-κB than type I or type III strains, and using forward genetics we found that this difference is a result of the polymorphic protein GRA15, a novel dense granule protein which T. gondii secretes into the host cell upon invasion. A GRA15-deficient type II strain has a severe defect in both NF-κB nuclear translocation and NF-κB-mediated transcription. Furthermore, human cells expressing type II GRA15 also activate NF-κB, demonstrating that GRA15 alone is sufficient for NF-κB activation. Along with the rhoptry protein ROP16, GRA15 is responsible for a large part of the strain differences in the induction of IL-12 secretion by infected mouse macrophages. In vivo bioluminescent imaging showed that a GRA15-deficient type II strain grows faster compared with wild-type, most likely through its reduced induction of IFN-γ. These results show for the first time that a dense granule protein can modulate host signaling pathways, and dense granule proteins can therefore join rhoptry proteins in T. gondii's host cell-modifying arsenal.
Figures
Figure 1.
T. gondii strains differ in the activation of NF-κB. HFFs were infected with T. gondii strains for 18–24 h, fixed, and stained with α–NF-κB p65 (red) and Hoechst dye (blue). Shown are infection with a type II (GFP) strain (A) or a type III (GFP) strain (B), and HFFs coinfected with a type I (non-GFP, arrow) and a type II (GFP) strain of T. gondii (C, brightfield; D, IF). Cells infected with only type I parasites (arrowhead) do not contain nuclear NF-κB. This experiment has been repeated >10× with similar results. Bars, 10 µm.
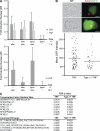
Figure 2.
Type I parasites do not inhibit NF-κB activation. (A) C57BL/6 BMMs were untreated, stimulated with 100 ng/ml LPS or 20 ng/ml mouse TNF, or infected with type I parasites (MOI = 2) for 1 h (top) or 18 h (bottom). Cells were then restimulated for 30 min with LPS or 45 min with TNF, fixed, and stained with α–NF-κB p65 and Hoechst dye. The intensity of nuclear NF-κB p65 was quantitated in at least 10 cells per treatment. Values represent the fold induction of nuclear p65 levels over uninfected unstimulated cells. This experiment was done once in BMM. A second experiment of HFFs infected with type I parasites and subsequently stimulated with TNF yielded similar results. Error bars represent standard deviation. (B) A 293 NF-κB GFP reporter cell line was plated on coverslips and infected with type I parasites (MOI = 1–2) for 45 min and then stimulated with 100 ng/ml human TNF for 4 h, fixed, and stained with α-SAG1 (red). Bars, 10 µm. The GFP intensity was quantitated for at least 30 infected cells and 30 uninfected cells (bottom; n.s. = not significant, two sample Student’s t tests). Horizontal bars represent the mean GFP intensity of cells. This experiment was performed twice, with the same qualitative results. Similar results were also obtained with a 293T NF-κB luciferase reporter cell line. (C) Microarray analysis was done on HFFs preinfected with a type I strain (MOI = 7.5) for 18 h, or left uninfected, and subsequently stimulated with 20 ng/ml human TNF for 6 h. Genes were preranked for both samples by the difference in expression, as compared with uninfected untreated HFFs, and GSEA was used to determine whether genes with NF-κB TFBS in their promoters or belonging to NF-κB–related canonical pathways were enriched in either or both samples. False discovery rate q-values <0.25 were considered significant. One array per strain and treatment was done.
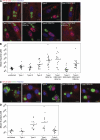
Figure 3.
GRA15 mediates NF-κB p65 translocation. (A) HFFs were infected with T. gondii strains for 18 h, fixed, and stained with α–NF-κB p65 (red), α-SAG1 (green), and Hoechst dye (blue). Bars, 10 µm. (B) The amount of p65 in the nucleus was quantitated in at least 15 HFF cells for each strain. Asterisks indicate significantly higher levels of nuclear p65 compared with uninfected cells (*, P < 0.001, two sample Student’s t tests). (C) Mouse BMDMs (BALB/c) were infected with T. gondii strains for 24 h, fixed, and stained with α–NF-κB p65 (red), α-SAG1 (green), and Hoechst dye (blue). Bars, 10 µm. (D) The level of nuclear p65 in infected cells was quantitated in at least 12 infected cells per strain. Asterisks indicate significantly higher levels of nuclear p65 compared with uninfected cells (*, P < 0.005, two sample Student’s t tests). One replicate experiment was done in both HFFs and mouse BMDM with similar qualitative results. Horizontal bars represent the mean nuclear p65 intensity over all cells.
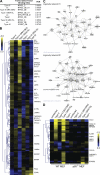
Figure 4.
GRA15 activates NF-κB–mediated transcription. HFFs or MEFs were infected for 18–24 h with type II, type II _GRA15_KO, type I, type III, type I _GRA15_II, or type III _GRA15_II T. gondii strains, and host cell gene expression was analyzed by Affymetrix microarrays. At least two arrays were done per strain in HFFs and one array was done per strain in MEFs. (A) The top three enriched known TFBSs from GSEAs comparing type II versus type II _GRA15_KO and type I/III _GRA15_II versus type I/III infections are shown. (B) For the 146 genes that are defined as core GRA15-regulated genes, mean log2 gene expression values were median centered, genes were clustered by hierarchical clustering, and a heat map is presented. The complete set of genes is listed in
Supplemental data 2
. (C) Ingenuity pathway analysis was done for these 146 genes. The top two scoring networks are shown. (D) In MEF arrays, 32 genes have the same expression level in uninfected unstimulated WT and p65−/− cells and are regulated by GRA15. For these genes, log2 expression values were median centered, genes were clustered by hierarchical clustering, and a heat map is shown. The complete set of genes is listed in
Supplemental data 2
.
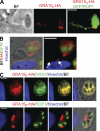
Figure 5.
GRA15 is a secreted dense granule protein. (A) Parasites expressing GFP and an HA-tagged copy of GRA15II were added to HFFs for 5 min to allow attachment and evacuole formation. Cells were then fixed and stained with α-HA (red), α-ROP1 (green), and Hoechst dye (blue). The HA tag is present with ROP1 in evacuoles, indicating that GRA15 can be secreted into the host cell. This experiment was repeated once with cytochalasin
d
–treated parasites with the same results. (B) Co-infection of type I (non-GFP) and type I _GRA15_II-HA (GFP) parasites, done once. Arrows indicate HA staining on the PVM of a non-GFP vacuole. (C) Co-staining of GRA15II-HA with a dense granule marker, GRA7, shows colocalization of HA staining and GRA7 in both the dense granules and the PV. Conversely, costaining of GRA15II-HA with a rhoptry marker, ROP1, shows almost no overlap between the HA tag and the rhoptries. Co-staining was done once, but the same GRA15II-HA staining pattern has been observed in more than five independent experiments. Bars, 5 µm.
Figure 6.
GRA15 activity affects total levels of phospho-IκBα but not PVM-associated phospho-IκBα. (A) HFFs were infected with T. gondii strains for 24 h or stimulated with TNF for indicated times, and cell lysates were collected, run on an SDS-PAGE gel, and Western blotted for phospho-IκBα, total IκBα, SAG1 (parasite loading control), and GAPDH (host cell loading control). From the total IκBα blot, the fraction of phosphorylated IκBα was determined by comparing the intensity of the upper band (phosphorylated form) to the total intensity of the lower and upper band. This experiment was repeated once with type I and type I GRA15II strains only with similar results. (B) HFFs were coinfected with type I (non-GFP) and type II (GFP) parasites, fixed, and stained with α–phospho-IκBα (red) and Hoechst dye (blue). A type I PVM (non-GFP, arrowhead) and a type II PVM (GFP, arrow) are indicated. Bar, 5 µm. (C) HFFs were infected with T. gondii strains expressing GFP for 24 h, fixed, and stained with α–phospho-IκBα (red) and Hoechst dye (blue). This experiment has been done three times with similar results. Bars, 1 µm.
Figure 7.
GRA15 activity is dependent on IKK-β and TRAF6 and independent of MyD88 and TRIF. Cells were infected with type I _GRA15_II or type I parasites for 4 h, stimulated with 20 ng/ml TNF for 1 h, or left unstimulated (US) and uninfected (UI). Cells were fixed and probed with an α–NF-κB p65 antibody and mean nuclear staining was measured. (A) HFF cells were preincubated with media containing 20 ng/ml MG-132 proteasome inhibitor before infection and TNF stimulation. (B–D) The activity of GRA15II in the absence of different components of the NF-κB pathway was assayed. (B) IKK-β−/− MEFs. (C) TRAF6−/− MEFs. (D) MyD88−/−/TRIF−/− BMMs. These experiments were repeated at least two times and quantification was performed on a representative experiment for each factor assayed. Asterisks (*) indicate data are significantly different (P-value < 0.05, Student’s t test), and n.s. indicates data are not significantly different. Horizontal bars represent the mean nuclear p65 intensity over all cells.
Figure 8.
GRA15 expression alone is sufficient to activate NF-κB in HeLa cells. (A) HeLa cells were transfected with _GRA15_II, an unrelated T. gondii gene (55.m04955), or an unrelated human gene (Mob1A) fused to GFP. Cells were then fixed and stained with α–NF-κB p65 (red) and Hoechst dye (blue). All cells expressing GRA15II-GFP contain activated NF-κB p65, whereas cells expressing 55.m04955-GFP or Mob1A-GFP do not. Nontransfected non-GFP cells in the same culture also have no nuclear NF-κB p65. This experiment was repeated two more times with the same results. (B) HeLa cells were infected with type I _GRA15_II or type I parasites for 24 h, fixed, and stained with α–NF-κB p65 (red) and Hoechst dye (blue). Cells infected with a type I _GRA15_II strain contain comparable amounts of nuclear NF-κB p65 to transfected cells. This experiment was repeated a second time with similar results. Bars, 10 µm.
Figure 9.
GRA15II promotes IL-12 secretion in vitro and affects parasite growth and host cytokine production in vivo. (A) BALB/c BMMs were infected with T. gondii strains for 24 h, supernatants were collected, and IL-12p40 levels were determined by cytokine ELISA. These experiments were performed at least three times in BMM using triplicate samples, as well as in RAW264.7 macrophages, all with similar results. (B–D) Mice were infected i.p. with tachyzoites of either a type II or a type II _GRA15_KO strain. (B) C57BL/6 or BALB/c mice were infected with 5,000 tachyzoites and survival of mice was monitored. In one experiment, five BALB/c mice were infected per strain, and in three separate experiments, a total of 25 C57BL/6 mice were infected per strain. (C) BALB/c mice were infected with parasites that express the enzyme luciferase. 5 d after infection, mice were i.p. injected with luciferin, anesthetized, and the flux (photons/sec/cm2/sr) was determined as a measure of parasite burden. Mice infected with a type II _GRA15_KO strain had significantly greater total flux (p/s) and, therefore, significantly greater parasite burden than mice infected with a type II strain. This burden difference 5 d after infection was observed in three independent experiments. (D) 1 or 2 d after infection, infected BALB/c mice were euthanized and an i.p. cavity wash was collected for IFN-γ, IL-12p70, and IL-12p40 cytokine ELISA. On day 2 after infection, mice infected with a type II _GRA15_KO strain had significantly lower levels of IFN-γ in the i.p. cavity than mice infected with a type II strain (P = 0.05, two-sample Student’s t test). Five mice were infected per strain per day. Day 2 cytokine levels were measured in a separate experiment with similar results. Error bars represent standard deviation from one experiment.
Comment in
- Parasitology: It takes II to induce NF-κB.
Huddleston JE. Huddleston JE. Nat Rev Microbiol. 2011 Mar;9(3):147. doi: 10.1038/nrmicro2532. Nat Rev Microbiol. 2011. PMID: 21451559 No abstract available.
Similar articles
- Toxoplasma gondii rhoptry 16 kinase promotes host resistance to oral infection and intestinal inflammation only in the context of the dense granule protein GRA15.
Jensen KD, Hu K, Whitmarsh RJ, Hassan MA, Julien L, Lu D, Chen L, Hunter CA, Saeij JP. Jensen KD, et al. Infect Immun. 2013 Jun;81(6):2156-67. doi: 10.1128/IAI.01185-12. Epub 2013 Apr 1. Infect Immun. 2013. PMID: 23545295 Free PMC article. - Transcriptomic analysis reveals Toxoplasma gondii strain-specific differences in host cell response to dense granule protein GRA15.
Liu Q, Gao WW, Elsheikha HM, He JJ, Li FC, Yang WB, Zhu XQ. Liu Q, et al. Parasitol Res. 2018 Sep;117(9):2785-2793. doi: 10.1007/s00436-018-5966-8. Epub 2018 Jun 19. Parasitol Res. 2018. PMID: 29916065 - Toxoplasma GRA15 Activates the NF-κB Pathway through Interactions with TNF Receptor-Associated Factors.
Sangaré LO, Yang N, Konstantinou EK, Lu D, Mukhopadhyay D, Young LH, Saeij JPJ. Sangaré LO, et al. mBio. 2019 Jul 16;10(4):e00808-19. doi: 10.1128/mBio.00808-19. mBio. 2019. PMID: 31311877 Free PMC article. - Armed and dangerous: Toxoplasma gondii uses an arsenal of secretory proteins to infect host cells.
Carruthers VB. Carruthers VB. Parasitol Int. 1999 Mar;48(1):1-10. doi: 10.1016/s1383-5769(98)00042-7. Parasitol Int. 1999. PMID: 11269320 Review. - [Research progress of interaction between Toxoplasma gondii rhoptry proteins and host cells].
Zhao GH, Yin SX, Yin K. Zhao GH, et al. Zhongguo Xue Xi Chong Bing Fang Zhi Za Zhi. 2014 Aug;26(4):453-6. Zhongguo Xue Xi Chong Bing Fang Zhi Za Zhi. 2014. PMID: 25434152 Review. Chinese.
Cited by
- An inside job: hacking into Janus kinase/signal transducer and activator of transcription signaling cascades by the intracellular protozoan Toxoplasma gondii.
Denkers EY, Bzik DJ, Fox BA, Butcher BA. Denkers EY, et al. Infect Immun. 2012 Feb;80(2):476-82. doi: 10.1128/IAI.05974-11. Epub 2011 Nov 21. Infect Immun. 2012. PMID: 22104110 Free PMC article. Review. - SAG2A protein from Toxoplasma gondii interacts with both innate and adaptive immune compartments of infected hosts.
Macêdo AG Jr, Cunha JP Jr, Cardoso TH, Silva MV, Santiago FM, Silva JS, Pirovani CP, Silva DA, Mineo JR, Mineo TW. Macêdo AG Jr, et al. Parasit Vectors. 2013 Jun 5;6:163. doi: 10.1186/1756-3305-6-163. Parasit Vectors. 2013. PMID: 23735002 Free PMC article. - Use and abuse of dendritic cells by Toxoplasma gondii.
Sanecka A, Frickel EM. Sanecka A, et al. Virulence. 2012 Nov 15;3(7):678-89. doi: 10.4161/viru.22833. Epub 2012 Nov 15. Virulence. 2012. PMID: 23221473 Free PMC article. Review. - Asexual expansion of Toxoplasma gondii merozoites is distinct from tachyzoites and entails expression of non-overlapping gene families to attach, invade, and replicate within feline enterocytes.
Hehl AB, Basso WU, Lippuner C, Ramakrishnan C, Okoniewski M, Walker RA, Grigg ME, Smith NC, Deplazes P. Hehl AB, et al. BMC Genomics. 2015 Feb 13;16(1):66. doi: 10.1186/s12864-015-1225-x. BMC Genomics. 2015. PMID: 25757795 Free PMC article. - Protein trafficking in apicomplexan parasites: crossing the vacuolar Rubicon.
Haldar K. Haldar K. Curr Opin Microbiol. 2016 Aug;32:38-45. doi: 10.1016/j.mib.2016.04.013. Epub 2016 May 4. Curr Opin Microbiol. 2016. PMID: 27155394 Free PMC article. Review.
References
- Altschul S.F., Gish W., Miller W., Myers E.W., Lipman D.J. 1990. Basic local alignment search tool. J. Mol. Biol. 215:403–410 - PubMed
- Boyer L., Travaglione S., Falzano L., Gauthier N.C., Popoff M.R., Lemichez E., Fiorentini C., Fabbri A. 2004. Rac GTPase instructs nuclear factor-kappaB activation by conveying the SCF complex and IkBalpha to the ruffling membranes. Mol. Biol. Cell. 15:1124–1133 10.1091/mbc.E03-05-0301 - DOI - PMC - PubMed
- Burg J.L., Perelman D., Kasper L.H., Ware P.L., Boothroyd J.C. 1988. Molecular analysis of the gene encoding the major surface antigen of Toxoplasma gondii. J. Immunol. 141:3584–3591 - PubMed
Publication types
MeSH terms
Substances
Grants and funding
- R01 AI080621/AI/NIAID NIH HHS/United States
- T32 GM007287/GM/NIGMS NIH HHS/United States
- AI080621/AI/NIAID NIH HHS/United States
- 5-T32-GM007287-33/GM/NIGMS NIH HHS/United States
LinkOut - more resources
Full Text Sources
Other Literature Sources
Molecular Biology Databases


