Notch1 loss of heterozygosity causes vascular tumors and lethal hemorrhage in mice - PubMed (original) (raw)
Notch1 loss of heterozygosity causes vascular tumors and lethal hemorrhage in mice
Zhenyi Liu et al. J Clin Invest. 2011 Feb.
Abstract
The role of the Notch signaling pathway in tumor development is complex, with Notch1 functioning either as an oncogene or as a tumor suppressor in a context-dependent manner. To further define the role of Notch1 in tumor development, we systematically surveyed for tumor suppressor activity of Notch1 in vivo. We combined the previously described Notch1 intramembrane proteolysis-Cre (Nip1::Cre) allele with a floxed Notch1 allele to create a mouse model for sporadic, low-frequency loss of Notch1 heterozygosity. Through this approach, we determined the cell types most affected by Notch1 loss. We report that the loss of Notch1 caused widespread vascular tumors and organism lethality secondary to massive hemorrhage. These findings reflected a cell-autonomous role for Notch1 in suppressing neoplasia in the vascular system and provide a model by which to explore the mechanism of neoplastic transformation of endothelial cells. Importantly, these results raise concerns regarding the safety of chronic application of drugs targeting the Notch pathway, specifically those targeting Notch1, because of mechanism-based toxicity in the endothelium. Our strategy also can be broadly applied to induce sporadic in vivo loss of heterozygosity of any conditional alleles in progenitors that experience Notch1 activation.
Figures
Figure 1. N1::Cre excises floxed Notch1 after activation.
(A and B) Loss of functional Notch1 is a low-frequency event, since only a small number of Cre6MT molecules reach the nucleus. C-terminal 6MT is omitted from the diagram for clarity. CoA, coactivator; CoR, corepressor; MAM, Mastermind. (C) All N1::Crelo/fl mice developed corneal plaques after 2–3 months, and this phenotype became more severe as animals aged. LacZ staining revealed that the transparent corneal was transformed into a skin-like structure with neoangiogenesis. Not all ECs and keratinocytes were labeled with lacZ. (D) N1::Crelo/fl mice showed increased angiogenesis in the ear. Scale bars: 150 μm (C); 10 mm (D).
Figure 2. N1::Crelo/fl mice developed vascular tumors.
(A) Kaplan-Meier survival analysis of 41 mutant and 45 control animals. Animals euthanized or alive at the time of analysis were censored (44 control and 26 mutant). (B) Summary of the major pathological findings from a comprehensive analysis of 13 pairs of control and mutant animals. Some animals developed hemangiomas in multiple tissues, making the tumor count greater than 13. The distribution of hemangiomas in different organs is further dissected (see Supplemental Table 1). (C–F) Representative images of spleen (C) and liver from N1::Crelo/+ (D) and N1::Crelo/fl animals (E and F). (E) Liver from a naturally deceased animal. (F) Liver from a euthanized N1::Crelo/fl animal, in which the tumors were still intact and filled with blood. (G–I) H&E liver sections from N1::Crelo/+ (G) and N1::Crelo/fl animals (H and I). See Results for details. (J–L) Immunostaining of liver tumor for PECAM (J), vWF (K), and PECAM and Ki67 (L). Inset in L shows the enlarged view of boxed area. Representative vascular tumors in other organs are shown in M (skin; H&E) and N (ovary; vWF). Scale bars: 50 μm; 10 μm (L, inset).
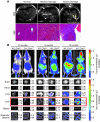
Figure 3. Imaging tumor progression.
(A) MRI was used to assess tumor progression in the liver. H&E images of the liver from respective animals are also shown. Scale bar: 100 μm. (B) Bioluminescence imaging of live animals and freshly dissected organs at the specified ages. Shown are mean and SD of organ luciferase signal (105 photons/s) from at least 4 different individuals of the same genotype. Organs showing statistically significant differences in signal intensity are boxed in red. See Supplemental Figure 6 for images of more organs.
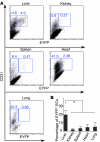
Figure 4. Comparison of the RosaEYFP reporter labeling efficiency in ECs of different organs in N1::Crelo/+RosaEYFP/LacZ mice.
(A) ECs from liver, kidney, spleen, heart, and lung were enriched, stained with CD45 and CD31, and subjected to flow cytometry analysis. Percent CD31+EYFP– and CD31+EYFP+ cells among CD45– cells is indicated. (B) Statistical analysis on 4 N1::Crelo/+RosaEYFP/LacZ mice showed that the liver had the highest percentage of EYFP+ ECs (about 20%, compared with less than 5% in other organs). *P < 0.05.
Figure 5. Characterization of vascular tumor cells.
(A) LacZ-, PECAM/EYFP-, and BrdU/EYFP-stained liver sections. A single, 2-hour-long pulse of BrdU labeled 5%–10% of ECs. Inset in right panel shows the enlarged view of boxed area. Scale bars: 50 μm; 10 μm (inset). (B–E) Immunostaining of phospho-Rb. Phospho-Rb signal was absent in areas without tumor (B and C); the presence of the signal (brown) is shown in D and E. Sections were counterstained with hematoxylin. The tumor identity in D and E was confirmed with PECAM and Ki67 costaining in Figure 2L (adjacent sections). Boxed regions in B and D are shown at higher magnification in C and E, respectively. Scale bars: 100 μm.
Figure 6. Loss of Notch1 in ECs is associated with their rapid expansion.
(A) Liver ECs were sorted to remove CD45+ cells and then separated based on the expression of EYFP and either CD105 (proliferating EC marker) or CD31 (pan-EC marker). (B) PCR analysis confirmed the deletion of floxed Notch1 allele in the majority of CD45–CD105+EYFP+ and CD45–CD105+EYFP– cells; in contrast, a substantial amount of floxed alleles was still detected in CD45–CD31+EYFP+ and CD45–CD31+EYFP– cells. The primers bind at positions illustrated in the diagram. Lanes a–f correspond with gates in A. M, molecular marker.
Comment in
- The cautionary tale of side effects of chronic Notch1 inhibition.
Ryeom SW. Ryeom SW. J Clin Invest. 2011 Feb;121(2):508-9. doi: 10.1172/JCI45976. Epub 2011 Jan 25. J Clin Invest. 2011. PMID: 21266769 Free PMC article.
Similar articles
- Cardiovascular and hematopoietic defects associated with Notch1 activation in embryonic Tie2-expressing populations.
Venkatesh DA, Park KS, Harrington A, Miceli-Libby L, Yoon JK, Liaw L. Venkatesh DA, et al. Circ Res. 2008 Aug 15;103(4):423-31. doi: 10.1161/CIRCRESAHA.108.177808. Epub 2008 Jul 10. Circ Res. 2008. PMID: 18617694 Free PMC article. - Notch1 functions as a negative regulator of lymphatic endothelial cell differentiation in the venous endothelium.
Murtomaki A, Uh MK, Choi YK, Kitajewski C, Borisenko V, Kitajewski J, Shawber CJ. Murtomaki A, et al. Development. 2013 Jun;140(11):2365-76. doi: 10.1242/dev.083865. Epub 2013 Apr 24. Development. 2013. PMID: 23615281 Free PMC article. - Mapping the consequence of Notch1 proteolysis in vivo with NIP-CRE.
Vooijs M, Ong CT, Hadland B, Huppert S, Liu Z, Korving J, van den Born M, Stappenbeck T, Wu Y, Clevers H, Kopan R. Vooijs M, et al. Development. 2007 Feb;134(3):535-44. doi: 10.1242/dev.02733. Development. 2007. PMID: 17215306 Free PMC article. - The NOTCH Pathway in Head and Neck Squamous Cell Carcinoma.
Fukusumi T, Califano JA. Fukusumi T, et al. J Dent Res. 2018 Jun;97(6):645-653. doi: 10.1177/0022034518760297. Epub 2018 Feb 28. J Dent Res. 2018. PMID: 29489439 Free PMC article. Review. - Phosphorylation-dependent regulation of Notch1 signaling: the fulcrum of Notch1 signaling.
Lee HJ, Kim MY, Park HS. Lee HJ, et al. BMB Rep. 2015 Aug;48(8):431-7. doi: 10.5483/bmbrep.2015.48.8.107. BMB Rep. 2015. PMID: 26058398 Free PMC article. Review.
Cited by
- Gauging NOTCH1 Activation in Cancer Using Immunohistochemistry.
Kluk MJ, Ashworth T, Wang H, Knoechel B, Mason EF, Morgan EA, Dorfman D, Pinkus G, Weigert O, Hornick JL, Chirieac LR, Hirsch M, Oh DJ, South AP, Leigh IM, Pourreyron C, Cassidy AJ, Deangelo DJ, Weinstock DM, Krop IE, Dillon D, Brock JE, Lazar AJ, Peto M, Cho RJ, Stoeck A, Haines BB, Sathayanrayanan S, Rodig S, Aster JC. Kluk MJ, et al. PLoS One. 2013 Jun 18;8(6):e67306. doi: 10.1371/journal.pone.0067306. Print 2013. PLoS One. 2013. PMID: 23825651 Free PMC article. - Notch suppresses angiogenesis and progression of hepatic metastases.
Banerjee D, Hernandez SL, Garcia A, Kangsamaksin T, Sbiroli E, Andrews J, Forrester LA, Wei N, Kadenhe-Chiweshe A, Shawber CJ, Kitajewski JK, Kandel JJ, Yamashiro DJ. Banerjee D, et al. Cancer Res. 2015 Apr 15;75(8):1592-602. doi: 10.1158/0008-5472.CAN-14-1493. Epub 2015 Mar 5. Cancer Res. 2015. PMID: 25744722 Free PMC article. - Notch Signaling and the Skeleton.
Zanotti S, Canalis E. Zanotti S, et al. Endocr Rev. 2016 Jun;37(3):223-53. doi: 10.1210/er.2016-1002. Epub 2016 Apr 13. Endocr Rev. 2016. PMID: 27074349 Free PMC article. Review. - The double-edged sword of Notch signaling in cancer.
South AP, Cho RJ, Aster JC. South AP, et al. Semin Cell Dev Biol. 2012 Jun;23(4):458-64. doi: 10.1016/j.semcdb.2012.01.017. Epub 2012 Jan 30. Semin Cell Dev Biol. 2012. PMID: 22309843 Free PMC article. Review. - NOTCH1 regulates migration and invasion of skin cancer cells by E-cadherin repression.
Wang Z, Liu L, Wang M, Shen M, Li J, Liu J, Li C, Xin C, Zhu S, Mei Q, Wang Y. Wang Z, et al. Mol Cell Biochem. 2012 Mar;362(1-2):35-41. doi: 10.1007/s11010-011-1125-6. Epub 2011 Oct 29. Mol Cell Biochem. 2012. PMID: 22038626
References
Publication types
MeSH terms
Substances
Grants and funding
- P50 CA094056/CA/NCI NIH HHS/United States
- U24CA83060/CA/NCI NIH HHS/United States
- R01 EY018826/EY/NEI NIH HHS/United States
- R01DK066408/DK/NIDDK NIH HHS/United States
- P50CA094056/CA/NCI NIH HHS/United States
- R01 DK066408/DK/NIDDK NIH HHS/United States
- P30 CA091842/CA/NCI NIH HHS/United States
- P30CA91842/CA/NCI NIH HHS/United States
- U24 CA083060/CA/NCI NIH HHS/United States
LinkOut - more resources
Full Text Sources
Other Literature Sources
Medical
Molecular Biology Databases
Research Materials


