Inhibition of multidrug resistance-linked P-glycoprotein (ABCB1) function by 5'-fluorosulfonylbenzoyl 5'-adenosine: evidence for an ATP analogue that interacts with both drug-substrate-and nucleotide-binding sites - PubMed (original) (raw)
. 2011 May 10;50(18):3724-35.
doi: 10.1021/bi200073f. Epub 2011 Apr 13.
Affiliations
- PMID: 21452853
- PMCID: PMC3108491
- DOI: 10.1021/bi200073f
Inhibition of multidrug resistance-linked P-glycoprotein (ABCB1) function by 5'-fluorosulfonylbenzoyl 5'-adenosine: evidence for an ATP analogue that interacts with both drug-substrate-and nucleotide-binding sites
Shinobu Ohnuma et al. Biochemistry. 2011.
Abstract
5'-Fluorosulfonylbenzonyl 5'-adenosine (FSBA) is an ATP analogue that covalently modifies several residues in the nucleotide-binding domains (NBDs) of several ATPases, kinases, and other proteins. P-glycoprotein (P-gp, ABCB1) is a member of the ATP-binding cassette (ABC) transporter superfamily that utilizes energy from ATP hydrolysis for the efflux of amphipathic anticancer agents from cancer cells. We investigated the interactions of FSBA with P-gp to study the catalytic cycle of ATP hydrolysis. Incubation of P-gp with FSBA inhibited ATP hydrolysis (IC(50 )= 0.21 mM) and the binding of 8-azido[α-(32)P]ATP (IC(50) = 0.68 mM). In addition, (14)C-FSBA cross-links to P-gp, suggesting that FSBA-mediated inhibition of ATP hydrolysis is irreversible due to covalent modification of P-gp. However, when the NBDs were occupied with a saturating concentration of ATP prior to treatment, FSBA stimulated ATP hydrolysis by P-gp. Furthermore, FSBA inhibited the photo-cross-linking of P-gp with [(125)I]iodoarylazidoprazosin (IAAP; IC(50) = 0.17 mM). As IAAP is a transport substrate for P-gp, this suggests that FSBA affects not only the NBDs but also the transport-substrate site in the transmembrane domains. Consistent with these results, FSBA blocked efflux of rhodamine 123 from P-gp-expressing cells. Additionally, mass spectrometric analysis identified FSBA cross-links to residues within or nearby the NBDs but not in the transmembrane domains, and docking of FSBA in a homology model of human P-gp NBDs supports the biochemical studies. Thus, FSBA is an ATP analogue that interacts with both the drug-binding and ATP-binding sites of P-gp, but fluorosulfonyl-mediated cross-linking is observed only at the NBDs.
Figures
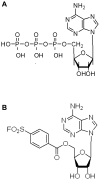
Figure 1
Chemical structures of ATP and FSBA. Comparison of the chemical structures of (A) ATP and (B) FSBA.
Figure 2
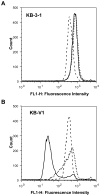
Effect of FSBA on the P-gp-mediated transport of fluorescent substrate. A flow cytometry-based assay showed accumulation of the fluorescent P-gp transport substrate rhodamine 123. Parental, KB-3-1 (A) and P-gp-expressing KB-V1 (B) cells (300,000/tube) were incubated with 0.5 μg/ml of rhodamine 123 for 45 min at 37°C in the dark, in the absence (control cells:—), or presence of 10 μM XR 9576 (----) or 1.5 mM FSBA (…..). The cells were then washed, resuspended in PBS with 0.1% BSA, and analyzed by flow cytometer as described in Materials and Methods. Representative histograms generated with Cell Quest software from three independent experiments are depicted.
Figure 3
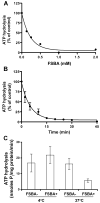
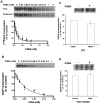
Effect of FSBA on P-gp-mediated ATP hydrolysis. (A) Inhibition of P-gp ATPase activity by FSBA. Vanadate-sensitive P-gp-mediated ATP hydrolysis was measured as described in Materials and Methods in the presence of increasing concentrations of FSBA (0–2 mM). In this experiment the FSBA was incubated with P-gp (10 μg protein/100 μl) for 30 min at 37°C prior to addition of 5 mM ATP. The IC50 (FSBA) for inhibition of P-gp-mediated ATP hydrolysis is 0.21 ± 0.05 mM. A representative plot is shown (n = 3). (B) Time course of the inhibition by FSBA of P-gp-mediated ATP hydrolysis. ATP hydrolysis was measured for 20 min following incubation of P-gp (10 μg/100 μl) with FSBA (1 mM) for increasing amounts of time. The t1/2 for the inhibition of ATP hydrolysis was 3.8 min. (C) Effect of temperature on the inhibition of P-gp-mediated ATP hydrolysis by FSBA. P-gp (10 μg/100 μl) was incubated for 30 min in the absence or presence FSBA (1 mM) at either 4°C or 37°C prior to initiating ATP hydrolysis at 37°C. The reaction conditions are shown on the figure. Data represent the mean values (± SD) obtained from at least 3 independent experiments.
Figure 4
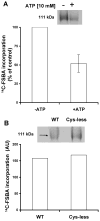
Crosslinking of [14C]FSBA to P-gp. (A) Purified P-gp (10–36 μg protein) reconstituted into proteoliposomes was incubated for 30 min at 37°C with 0.4 mM [14C]FSBA in the presence or absence of 10 mM ATP. The samples were then electrophoresed and the dried gel was exposed to an X-ray film at −70°C for 3–7 days. (B) Purified wild-type P-gp and the cys-less mutant (60 μg protein) was reconstituted into proteoliposomes and incubated for 30 min at 37°C with 0.35 mM [14C]FSBA. The samples were then electrophoresed, the dried gel was exposed to an X-ray film at −70°C for 3–7 days. In both (A) and (B) the section of the autoradiogram with the P-gp band is indicated and the bar graphs show the mean ± SD values following quantification, which was carried out using the STORM 860 PhosphorImager system with a high sensitivity screen and the software ImageQuaNT.
Figure 5
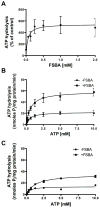
Characterization of the FSBA-mediated stimulation of ATP hydrolysis by P-gp. (A) The experiment was performed as described in (Fig. 3A), except that a saturating concentration of ATP (5 mM) was added prior to the addition of FSBA. All additions were made on ice and the ATPase reaction was initiated by warming the tubes to 37°C. The concentration of FSBA required for 50% stimulation of P-gp-mediated ATPase activity of P-gp is 0.07 ± 0.05 mM. (B) Michaelis-Menten kinetics of P-gp-mediated ATP hydrolysis were determined in the absence (●) or presence (■) of FSBA (2 mM). Km (ATP) values in the absence and presence of FSBA were 0.54 ± 0.17 mM and 0.64 ± 0.14 mM respectively and the Vmax values were 21.4 and 58.9 nmoles Pi/mg protein/min, respectively. Note that both ATP and FSBA were added at the same time without any prior incubation at 37°C. (C) Michaelis-Menten kinetics of P-gp-mediated ATP hydrolysis were determined in the absence (●) or presence (■) of FSBA (2 mM). P-gp was incubated in the presence or absence of FSBA (2 mM) and 5 mM ATP for 30 min at 37°C in the absence of Mg2+. ATP hydrolysis was then initiated by the addition of 10 mM MgCl2. Km (ATP) values, in the absence and presence of FSBA, were 0.44 ± 0.14 mM and 1.31 ± 0.18 mM, respectively. The data points in all graphs (A,B,C) represent the mean values ± SD obtained from at least three independent experiments and the kinetic parameters were estimated using the curve-fitting software GraphPad PRIZM.
Figure 6
FSBA binds to the drug-substrate site(s) and inhibits photolabeling of P-gp with [125I]IAAP. (A) The apparent affinities of FSBA for the substrate-binding sites of WT-P-gp were estimated by monitoring the crosslinking of the photoaffinity analog of prazosin, [125I]IAAP in the presence of increasing concentrations of FSBA (0–2 mM) in the absence (●) or presence of 5 mM ATP (■), as described in Materials and Methods. (B) The apparent affinity of FSBA for the substrate-binding sites of the Y401A/Y1044A mutant-P-gp, which cannot bind ATP, was estimated as described in (A). For experiments in (A) and (B), 5–7 nM [125I]IAAP was used. Photoaffinity labeling of wild-type (C) and Y401A/1044A mutant (D) with IAAP after the formation of FSBA-P-gp adduct. P-gp containing crude membranes (500 μg protein) was treated with or without FSBA (2 mM) in 1 ml ATPase buffer for 30 min at 37°C. The samples were washed by centrifugation at 200,000 × g for 20 min at 4°C to remove the excess FSBA, resuspended in ice-cold 150 μl of ATPase buffer, and 10 μl washed membranes (50–75 μg protein) were incubated with 10 nM IAAP and photocrosslinked as described in Materials and Methods. Finally, all samples were electrophoresed and the dried gel was exposed to an X-ray film. The upper panel depicts the autoradiogram from a representative experiment and similar results were obtained in two additional experiments. The radioactivity associated with the P-gp band was quantified and represented in the lower panels using a phosphorimager and the curve-fitting software GraphPad PRIZM (for panels A and B). In (A) upper, an autoradiogram depicts FSBA treatment in the absence (free) and the presence of 5 mM ATP (protected).
Figure 7
Identification of FSBA-labeled sites using MALDI-TOF MS. Purified and reconstituted P-gp (10–20 μg protein) was incubated with 2 mM FSBA at 37°C for 30 min either in the presence or absence of 5 mM ATP. The samples were run on a 7% NuPage gel at constant voltage (150 V). Protein (P-gp) bands excised from polyacrylamide gels were subjected to in-gel trypsin digestion followed by MALDI-TOF MS, as described in the Materials and Methods. Representative regions of the MS spectrum of control, i.e. untreated (bottom), or FSBA-treated (top) are shown. The peak at m/z=898.95 represents an unmodified peptide (peptide# 2 in Table 1) that shifts to m/z=1331.85 following FSBA modification (marked with an arrow).
Figure 8
Modeling of FSBA in NDBs of human P-gp. The homology model of NBDs of human P-gp using the HlyB NBD structure was generated as described in Materials and Methods. (A) Modeling of FSBA at the NBD1. The FSBA molecule is docked at the NBD1 with its adenine group π-stacked to the aromatic ring of Y-401 (A-loop). An original FSBA conformation was generated by the program Vina-Autodock, and then the protein-FSBA complex was energy-minimized using CHARMm. (B) Modeling of FSBA at the NBD2. The FSBA molecule is docked at nucleotide-binding site 2 with its adenine group π-stacked to the aromatic ring of Y-1044 (A-loop). An original FSBA conformation was built manually into the NBD2 through molecular torsions, and then the protein-FSBA complex was energy-minimized using CHARMm. (C) and (D) Location of the FSBA-labeled peptides in the model of human P-gp NBDs. The peptides are painted in different colors and numbered the same as in Table 1. Target residues are also shown in stick models and labeled. The NBD model is shown in two orientations: (C) NBD1 to the left and NBD2 to the right and (D) NBD2 to the left and NBD1 to the right. Figures in A and B are colored as: NBD1=cyan, NBD2=magenta; ATP=blue and FSBA=red; Y-401/Y-1044=orange. Figure C and D: NBD1=light grey, NBD2=dark grey; O=red, N=blue, S=yellow, F=light blue, P=orange, Mg2+=black ball (only shown in C and D); and created with PyMOL (The PyMOL Molecular Graphics System, Schrödinger, LLC).
Similar articles
- Multiple transport-active binding sites are available for a single substrate on human P-glycoprotein (ABCB1).
Chufan EE, Kapoor K, Sim HM, Singh S, Talele TT, Durell SR, Ambudkar SV. Chufan EE, et al. PLoS One. 2013 Dec 5;8(12):e82463. doi: 10.1371/journal.pone.0082463. eCollection 2013. PLoS One. 2013. PMID: 24349290 Free PMC article. - Both ATP sites of human P-glycoprotein are essential but not symmetric.
Hrycyna CA, Ramachandra M, Germann UA, Cheng PW, Pastan I, Gottesman MM. Hrycyna CA, et al. Biochemistry. 1999 Oct 19;38(42):13887-99. doi: 10.1021/bi991115m. Biochemistry. 1999. PMID: 10529234 - Characterization of an asymmetric occluded state of P-glycoprotein with two bound nucleotides: implications for catalysis.
Siarheyeva A, Liu R, Sharom FJ. Siarheyeva A, et al. J Biol Chem. 2010 Mar 5;285(10):7575-86. doi: 10.1074/jbc.M109.047290. Epub 2010 Jan 8. J Biol Chem. 2010. PMID: 20061384 Free PMC article. - About a switch: how P-glycoprotein (ABCB1) harnesses the energy of ATP binding and hydrolysis to do mechanical work.
Sauna ZE, Ambudkar SV. Sauna ZE, et al. Mol Cancer Ther. 2007 Jan;6(1):13-23. doi: 10.1158/1535-7163.MCT-06-0155. Mol Cancer Ther. 2007. PMID: 17237262 Review. - Structure of multidrug-resistance proteins of the ATP-binding cassette (ABC) superfamily.
Altenberg GA. Altenberg GA. Curr Med Chem Anticancer Agents. 2004 Jan;4(1):53-62. doi: 10.2174/1568011043482160. Curr Med Chem Anticancer Agents. 2004. PMID: 14754412 Review.
Cited by
- Sulfonyl fluorides as privileged warheads in chemical biology.
Narayanan A, Jones LH. Narayanan A, et al. Chem Sci. 2015 May 1;6(5):2650-2659. doi: 10.1039/c5sc00408j. Epub 2015 Mar 16. Chem Sci. 2015. PMID: 28706662 Free PMC article. - Structures of the Multidrug Transporter P-glycoprotein Reveal Asymmetric ATP Binding and the Mechanism of Polyspecificity.
Esser L, Zhou F, Pluchino KM, Shiloach J, Ma J, Tang WK, Gutierrez C, Zhang A, Shukla S, Madigan JP, Zhou T, Kwong PD, Ambudkar SV, Gottesman MM, Xia D. Esser L, et al. J Biol Chem. 2017 Jan 13;292(2):446-461. doi: 10.1074/jbc.M116.755884. Epub 2016 Nov 18. J Biol Chem. 2017. PMID: 27864369 Free PMC article. - MDR1 synonymous polymorphisms alter transporter specificity and protein stability in a stable epithelial monolayer.
Fung KL, Pan J, Ohnuma S, Lund PE, Pixley JN, Kimchi-Sarfaty C, Ambudkar SV, Gottesman MM. Fung KL, et al. Cancer Res. 2014 Jan 15;74(2):598-608. doi: 10.1158/0008-5472.CAN-13-2064. Epub 2013 Dec 4. Cancer Res. 2014. PMID: 24305879 Free PMC article. - Multiple transport-active binding sites are available for a single substrate on human P-glycoprotein (ABCB1).
Chufan EE, Kapoor K, Sim HM, Singh S, Talele TT, Durell SR, Ambudkar SV. Chufan EE, et al. PLoS One. 2013 Dec 5;8(12):e82463. doi: 10.1371/journal.pone.0082463. eCollection 2013. PLoS One. 2013. PMID: 24349290 Free PMC article. - Conserved Walker A cysteines 431 and 1074 in human P-glycoprotein are accessible to thiol-specific agents in the apo and ADP-vanadate trapped conformations.
Sim HM, Bhatnagar J, Chufan EE, Kapoor K, Ambudkar SV. Sim HM, et al. Biochemistry. 2013 Oct 15;52(41):7327-38. doi: 10.1021/bi4007786. Epub 2013 Oct 4. Biochemistry. 2013. PMID: 24053441 Free PMC article.
References
- Dean M, Annilo T. Evolution of the ATP-binding cassette (ABC) transporter superfamily in vertebrates. Annu Rev Genomics Hum Genet. 2005;6:123–142. - PubMed
- Gottesman MM, Ambudkar SV. Overview: ABC transporters and human disease. J Bioenerg Biomembr. 2001;33:453–458. - PubMed
- Juliano RL, Ling V. A surface glycoprotein modulating drug permeability in Chinese hamster ovary cell mutants. Biochim Biophys Acta. 1976;455:152–162. - PubMed
- Gottesman MM, Fojo T, Bates SE. Multidrug resistance in cancer: role of ATP-dependent transporters. Nat Rev Cancer. 2002;2:48–58. - PubMed
Publication types
MeSH terms
Substances
LinkOut - more resources
Full Text Sources
Research Materials
Miscellaneous
