Artificial selection for a green revolution gene during japonica rice domestication - PubMed (original) (raw)
. 2011 Jul 5;108(27):11034-9.
doi: 10.1073/pnas.1019490108. Epub 2011 Jun 6.
Masanori Yamasaki, Shohei Takuno, Kotaro Miura, Satoshi Katagiri, Tomoko Ito, Kazuyuki Doi, Jianzhong Wu, Kaworu Ebana, Takashi Matsumoto, Hideki Innan, Hidemi Kitano, Motoyuki Ashikari, Makoto Matsuoka
Affiliations
- PMID: 21646530
- PMCID: PMC3131315
- DOI: 10.1073/pnas.1019490108
Artificial selection for a green revolution gene during japonica rice domestication
Kenji Asano et al. Proc Natl Acad Sci U S A. 2011.
Abstract
The semidwarf phenotype has been extensively selected during modern crop breeding as an agronomically important trait. Introduction of the semidwarf gene, semi-dwarf1 (sd1), which encodes a gibberellin biosynthesis enzyme, made significant contributions to the "green revolution" in rice (Oryza sativa L.). Here we report that SD1 was involved not only in modern breeding including the green revolution, but also in early steps of rice domestication. We identified two SNPs in O. sativa subspecies (ssp.) japonica SD1 as functional nucleotide polymorphisms (FNPs) responsible for shorter culm length and low gibberellin biosynthetic activity. Genetic diversity analysis among O. sativa ssp. japonica and indica, along with their wild ancestor O. rufipogon Griff, revealed that these FNPs clearly differentiate the japonica landrace and O. rufipogon. We also found a dramatic reduction in nucleotide diversity around SD1 only in the japonica landrace, not in the indica landrace or O. rufipogon. These findings indicate that SD1 has been subjected to artificial selection in rice evolution and that the FNPs participated in japonica domestication, suggesting that ancient humans already used the green revolution gene.
Conflict of interest statement
The authors declare no conflict of interest.
Figures
Fig. 1.
QTL analysis for CL and isolation of qCL1a. (A and B) Gross morphology (A) and CL (B) of Nipponbare and Kasalath at the mature stage. (Scale bar in A: 20 cm.) Asterisks in B indicate a significant difference (P < 0.001) according to the t test. Error bars represent the SD from the mean (n = 6). (C) QTL analysis for CL in a BIL population. The circles indicate the positions of QTLs, and the circle sizes indicate the relative contribution of each QTL. The red and blue circles indicate QTLs that Nipponbare and Kasalath alleles contribute to the elongation of CL, respectively. qCL1 is marked on chromosome 1. (D) High-resolution mapping of qCL1. (Left) Graphical genotypes of four selected recombinant homozygous lines. The horizontal lines represent chromosome 1, and a physical map is shown for the qCL1 region of chromosome 1. The vertical bars represent the molecular markers. The white and gray bars indicate homozygous alleles of Nipponbare and Kasalath, respectively. (Right) CL for each recombinant homozygous line. Letters (a–d) denote statistically significant differences (P < 0.05) according to Tukey's test. Error bars indicate the SD from the mean (n = 5). (E) Comparison of SD1 amino acid sequences between Nipponbare and Kasalath. The yellow squares and horizontal lines denote the exons and introns of SD1, respectively. The amino acid sequences of GA20ox proteins from Nipponbare, Kasalath, O. rufipogon, maize, barley, wheat, Arabidopsis, pea, tobacco, and tomato were aligned using ClustalW, followed by manual alignment. The red triangles indicate amino acid substitutions between Nipponbare and Kasalath.
Fig. 2.
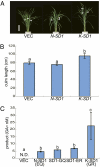
Comparison of the SD1 alleles from Nipponbare and Kasalath. (A) Phenotype of transgenic plants containing the additional SD1 allele: from left to right, transgenic plants containing empty vector (VEC), the Nipponbare allele (N-SD1), and the Kasalath allele (K-SD1). The white arrowheads indicate the position of the panicle node. (Scale bar in A: 20 cm.) (B) CL in transgenic plants containing additional SD1. The letters a and b denote statistically significant differences (P < 0.05) according to Tukey's test. Error bars represent the SD from the mean of the longest culms (n = 15). (C) GA biosynthetic activity of SD1. N.D., not detected. The letters a–c denote statistically significant differences (P < 0.05) according to Tukey's test. Error bars represent the SD from the mean (n = 3).
Fig. 3.
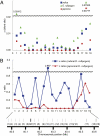
Genetic diversity analysis around the SD1 region. (A) Values of π for the silent site of japonica (red circle), indica (blue square), and O. rufipogon (green triangle) across the SD1 genomic region of chromosome 1. (B) Nucleotide variation in japonica or indica relative to O. rufipogon. The blue and red lines indicate the ratios of all site nucleotide diversities in indica and japonica relative to O. rufipogon, respectively. In both A and B, ∼180- to 880-bp portions of 18 flanking genes were sequenced, along with the entire SD1 gene. The approximate genomic locations of the genes are indicated by solid bars, with the following gene identities: 1, hypothetical protein; 2, hypothetical protein; 3, leucine-rich repeat, cysteine-containing containing protein; 4, protein of unknown function, DUF803 family protein; 5, hypothetical protein; 6, SD1; 7, Armadillo-like helical domain containing protein; 8, conserved hypothetical protein; 9, conserved hypothetical protein; 10, similar to AGAMOUS homolog; 11, similar to EMB1879 (EMBRYO DEFECTIVE 1879); 12, hypothetical protein; 13, similar to NAC-domain containing protein 18 (ANAC018) (NO APICAL MERISTEM protein; AtNAM); 14, RIO-like kinase domain-containing protein; 15, similar to LOB domain protein 6 (ASYMMETRIC LEAVES2); 16, hypothetical conserved gene; 17, hypothetical protein; 18, hypothetical conserved gene, and 19, metallophosphoesterase domain-containing protein.
Fig. 4.
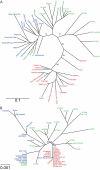
Phylogenetic trees based on genome-wide transposon insertion patterns (A) and the SD1 genomic sequence (B). Landraces and accessions are indicated by red for japonica, blue for indica, and green for O. rufipogon. Bootstrap values (%) were obtained by 1,000 bootstrap replicates.
Fig. 5.
Model of the domestication process in rice. The blue and red circles indicate two genetically distinct groups, indica and japonica, and their corresponding ancestor, O. rufipogon. “GR” enclosed by a blue rectangle or ellipse indicates a GR-type SD1 allele. “EQ” enclosed by red ellipse indicate an EQ-type SD1 allele. Rectangles and ellipses indicate indica and _japonica_-like alleles in relation to sequences outside of the FNPs of SD1, respectively. Genes indicated by blue and red letters are genes introgressed from japonica into indica and genes isolated into the japonica population, respectively.
Comment in
- Paleo-Green Revolution for rice.
Paterson AH, Li ZK. Paterson AH, et al. Proc Natl Acad Sci U S A. 2011 Jul 5;108(27):10931-2. doi: 10.1073/pnas.1107959108. Epub 2011 Jun 21. Proc Natl Acad Sci U S A. 2011. PMID: 21693643 Free PMC article. No abstract available.
Similar articles
- Identification and genetic analysis of qCL1.2, a novel allele of the "green revolution" gene SD1 from wild rice (Oryza rufipogon) that enhances plant height.
Zhang L, Huang J, Wang Y, Xu R, Yang Z, Zhao Z, Liu S, Tian Y, Zheng X, Li F, Wang J, Song Y, Li J, Cui Y, Zhang LF, Cheng Y, Lan J, Qiao W, Yang Q. Zhang L, et al. BMC Genet. 2020 Jun 11;21(1):62. doi: 10.1186/s12863-020-00868-w. BMC Genet. 2020. PMID: 32527215 Free PMC article. - Nonindependent domestication of the two rice subspecies, Oryza sativa ssp. indica and ssp. japonica, demonstrated by multilocus microsatellites.
Gao LZ, Innan H. Gao LZ, et al. Genetics. 2008 Jun;179(2):965-76. doi: 10.1534/genetics.106.068072. Epub 2008 May 27. Genetics. 2008. PMID: 18505887 Free PMC article. - Phylogeography of Asian wild rice, Oryza rufipogon, reveals multiple independent domestications of cultivated rice, Oryza sativa.
Londo JP, Chiang YC, Hung KH, Chiang TY, Schaal BA. Londo JP, et al. Proc Natl Acad Sci U S A. 2006 Jun 20;103(25):9578-83. doi: 10.1073/pnas.0603152103. Epub 2006 Jun 9. Proc Natl Acad Sci U S A. 2006. PMID: 16766658 Free PMC article. - New insights into the history of rice domestication.
Kovach MJ, Sweeney MT, McCouch SR. Kovach MJ, et al. Trends Genet. 2007 Nov;23(11):578-87. doi: 10.1016/j.tig.2007.08.012. Epub 2007 Oct 25. Trends Genet. 2007. PMID: 17963977 Review. - The complex history of the domestication of rice.
Sweeney M, McCouch S. Sweeney M, et al. Ann Bot. 2007 Nov;100(5):951-7. doi: 10.1093/aob/mcm128. Epub 2007 Jul 6. Ann Bot. 2007. PMID: 17617555 Free PMC article. Review.
Cited by
- Genome-wide view of genetic diversity reveals paths of selection and cultivar differentiation in peach domestication.
Akagi T, Hanada T, Yaegaki H, Gradziel TM, Tao R. Akagi T, et al. DNA Res. 2016 Jun;23(3):271-82. doi: 10.1093/dnares/dsw014. Epub 2016 Apr 15. DNA Res. 2016. PMID: 27085183 Free PMC article. - Crop genomics: advances and applications.
Morrell PL, Buckler ES, Ross-Ibarra J. Morrell PL, et al. Nat Rev Genet. 2011 Dec 29;13(2):85-96. doi: 10.1038/nrg3097. Nat Rev Genet. 2011. PMID: 22207165 Review. - Overexpression of OsbHLH107, a member of the basic helix-loop-helix transcription factor family, enhances grain size in rice (Oryza sativa L.).
Yang X, Ren Y, Cai Y, Niu M, Feng Z, Jing R, Mou C, Liu X, Xiao L, Zhang X, Wu F, Guo X, Jiang L, Wan J. Yang X, et al. Rice (N Y). 2018 Jul 20;11(1):41. doi: 10.1186/s12284-018-0237-y. Rice (N Y). 2018. PMID: 30030651 Free PMC article. - How does nitrogen shape plant architecture?
Luo L, Zhang Y, Xu G. Luo L, et al. J Exp Bot. 2020 Jul 25;71(15):4415-4427. doi: 10.1093/jxb/eraa187. J Exp Bot. 2020. PMID: 32279073 Free PMC article. Review. - Genome-Wide Association Study of Seed Dormancy and the Genomic Consequences of Improvement Footprints in Rice (Oryza sativa L.).
Lu Q, Niu X, Zhang M, Wang C, Xu Q, Feng Y, Yang Y, Wang S, Yuan X, Yu H, Wang Y, Chen X, Liang X, Wei X. Lu Q, et al. Front Plant Sci. 2018 Jan 5;8:2213. doi: 10.3389/fpls.2017.02213. eCollection 2017. Front Plant Sci. 2018. PMID: 29354150 Free PMC article.
References
- Doebley JF, Gaut BS, Smith BD. The molecular genetics of crop domestication. Cell. 2006;127:1309–1321. - PubMed
- Harlan J. Crops and Man. 2nd Ed. Madison, WI: American Society of Agronomy; 1992.
- Kovach MJ, Sweeney MT, McCouch SR. New insights into the history of rice domestication. Trends Genet. 2007;23:578–587. - PubMed
- Sang T, Ge S. Genetics and phylogenetics of rice domestication. Curr Opin Genet Dev. 2007;17:533–538. - PubMed
Publication types
MeSH terms
Substances
LinkOut - more resources
Full Text Sources
Other Literature Sources
Research Materials


